Should-Read: Robert Waldmann: Marking My Beliefs To Market: UK Violent Crime

Should-Read: Robert Waldmann: Marking My Beliefs To Market: UK Violent Crime: “The lead causes crime hypothesis…

…I consider myself an early supporter…. In April 2008, I predicted that the UK violent crime rate would peak some time around 2008 <http://rjwaldmann.blogspot.it/2008/04/get-lead-out-in-freakiest-bit-of.html>. I just googled and found that it peaked in around 2006 or 2007. I’d say the prediction worked out pretty well.

Robert s Stochastic thoughts Marking My Beliefs To Market

Must- and Should-Reads: February 17, 2017


Interesting Reads:

Must-Read: David Anderson: Governing Is Hard

Must-Read: The right moment for Republicans interested in health policy to intervene in the politics was back in 2010, when the “repeal and replace” meme was first decided on. They should have said: “Hell, no!–You really do not want to say that.”

My suspicion is that they thought the battle was not worth fighting because the dog would never catch the car. The least they could do is apologize to the rest of us now…

David Anderson: Governing Is Hard: “The Republican Party has an ACA problem.  The ACA is deficit reducing…

…raised taxes on upper income families…. But the Republican Party is ideologically committed to lower taxes on high income families. The Republican Party has a policy problem. It needs to offer something that is close enough to coverage to minimize blowback of sympathetic figures crying on camera that the Republican health policy bill will kill them. So that means some type of coverage.  And that means spending some money…. So here is what the Republican Party’s wonks are proposing:

Republicans are considering capping the U.S.’s tax break on job-provided health insurance, a major change to the tax system that could be used to finance their efforts to repeal and replace Obamacare.

This is a big pool of money… a quarter trillion dollars a year… a regressive tax benefit where the benefits mostly accrue to upper income individuals…. Most liberal wonks (myself included) will agree that building a system from scratch, ESI tax exclusion would never be part of an ideal package. BUT HERE IS THE PROBLEM.  It pisses off voters who receive coverage through work. And we already sort of tried this route before:

A similar idea was proposed by Senator Ron Wyden, a Democrat, during debate over the Affordable Care Act, and went nowhere. Obamacare already includes a levy on high-cost health insurance plans, known as the Cadillac tax, that begins in 2020. Republicans didn’t say where they would set the cap….

If the Republicans need to raise serious money from this exclusion being rolled back ($50 to $100 billion a year is serious), it means the tax hits most employer sponsored health plans to some degree.  If they don’t raise serious money because they fear blowback, it is a high income earner only tax and it still leaves their plan with a massive hole.

The easiest solution for Republicans looking for money…. Just borrow it…. But I can’t see how this proposal would get 150 votes in the House or 40 in the Senate.

Whenever before Republicans have found themselves in a serious box, the out has been: Just “dynamic score” it so you can claim you aren’t borrowing it, and then–“LOOK! IT’S HALLEY’S COMET!!”

Should-Read: Ben Thompson: DistroKid, The “Publisher’s Right”, Shopify’s Results

Should-Read: Ben Thompson: DistroKid, The “Publisher’s Right”, Shopify’s Results: “As I’ve noted… the old value chain had three parts: supply — distribution — demand…

…The value in that value chain derived from supply owning distribution, which let said suppliers bundle the content that was in demand with ads. Per the previous item, though, the Internet has completely destroyed the value of distribution: it’s basically free, which is another way of saying it is worthless. The replacement for distribution in the value chain was instead discovery: now that everything was available everywhere, how were consumers demanding content to find what they wished to read?

What these European publishers continue not to grok is that while distribution inherently favored the supply side, discovery inherently favors the demand side. Specifically, publishers controlled distribution, while consumers control discovery. That is why the suggestion that Google owes publishers a dime is completely at odds with economic reality. The truth is that any publisher can, at any time, remove itself from Google News, or Facebook, and any of the other discovery mechanisms, and instead wait for consumers to go to them directly. That publishers (for very good reasons) don’t have faith that consumers will do that is the real cause of their economic troubles.

To return to the publishing curve, Google is closer to customers; the only way for publishers to extract the value they think is theirs it to get even closer. And, by extension, demanding the EU intervene will lead to a predictable outcome: Google will simply exit the market taking all of the customers who are quite happy with Google’s discovery functionality with them, leaving publishers with the emptiest of victories…

Should-Read: Charles Wyplosz: When the IMF Evaluates the IMF

Should-Read: Charles Wyplosz: When the IMF Evaluates the IMF: “Two critical mistakes are not mentioned…

…Debt Sustainability Analysis…. As with all compounding exercises over long horizons, the results are extremely sensitive to small changes in the assumptions. The debt path, therefore, is no more than the unstable representation of assumptions, as are the benchmarks (Wyplosz 2011)…. Zettelmeyer et al. (2017) show that the confidence intervals are very wide, casting doubt on whether any policy conclusion can be drawn from DSA. Sadly, there is no hint in the report that the Fund is ready to question this procedure….

Preventing the crisis was therefore in the interest of a large number of important countries, which raises the issue of burden sharing…. Instead, as we know, Greece was instructed to borrow, which means that the burden has fallen entirely on its taxpayers. The burden is so heavy that the IMF now calls for a debt reduction, which would be ex post burden sharing. As the world’s benevolent referee, it should have refused ex ante to be complicit and part of such an imbalanced approach. The issue of burden sharing is not even mentioned in the report….

The IMF must be commended for imposing self-evaluation reports upon itself…. The fact that self-evaluation occurs and that the report is made public deserves to be commended. The procedure should be a model for the two other Troika institutions, the European Commission and the ECB. Most regrettably, self-evaluation is not part of their institutional culture. They seem to follow the prescription attributed to Napoleon: “In politics never retreat, never retract, never admit a mistake”. 

Are shocks to U.S. firm performance transmitted to their workers?

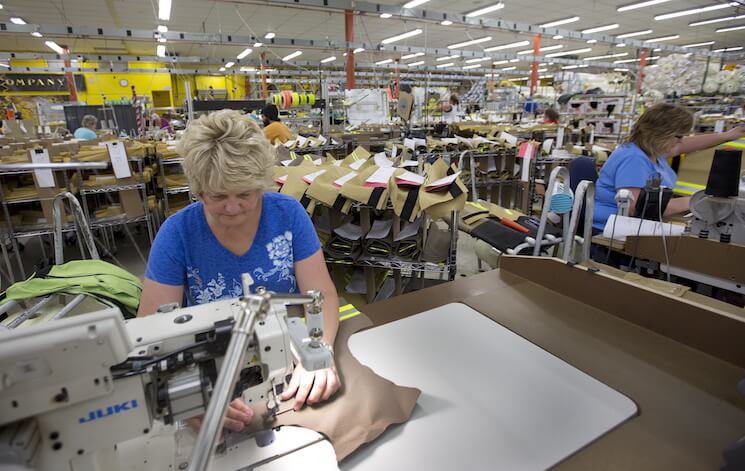
Misty Thurston stitches suits for firefighters at Globe Manufacturing Co. in Pittsfield, N.H. A new paper looks at whether fluctuations in employers’ revenue affects workers’ earnings.

The most important source of income for most families is earnings from work. If the firms where they work are subject to fluctuations in revenue, and if these fluctuations are passed on to workers through a shift in their earnings, families could experience a significant volatility in income. Income instability—how much incomes fluctuate up and down over time— has grown significantly over the past few decades, making it difficult for millions of families to plan financially for the future.

Given the concern that Americans may now be subject to greater financial risk and economic insecurity, a new paper by Chinhui Juhn of University of Houston and her coauthors investigates whether changes in market demand faced by employers are important sources of volatility in workers’ earnings, or are workers insulated from these shocks?

The researchers’ results suggest that most firms try to insulate workers from shocks to firm performance. Workers in the bottom fifth of earners within a firm are the most “insured” against firm-level shocks while the top 5 percent experience more volatility, probably because performance pay incentives outweigh insurance concerns for higher-paid workers.

By using a set of firm-level revenue data linked to administrative records on employee earnings and characteristics for the United States, the researchers examine the extent to which shocks to firm performance influence change earnings for workers who stay on the job. Do firms actually shield workers from financial risk, providing both employment and insurance?

The authors find that the extent to which worker earnings are insulated varies by the size of the change in revenue, the type of worker, and the type of industry. Interestingly, changes in earnings vary by relative rank of a worker in the firm. The highest paid workers (the top 5 percent of earners) have the greatest earnings volatility among continuing workers or “stayers.” Some economists posit that this relationship is a feature of performance pay, rent sharing, or the shift to bonus pay.

The literature on performance pay suggests that workers who have large and direct impacts on firm performance face the largest trade-offs between having wages that are tied to firm revenues, which incentivizes hard work, and having “wage insurance” that reduces risk through consistent pay regardless of firm revenues. Ideas about performance pay are similar to the rent-sharing hypothesis, which contends that firms share excess profits with their workers in the form of higher relative wages. Diego Comin of Dartmouth College, Erica Groshen of the U.S. Bureau of Labor Statistics and Bess Robin of the Federal Reserve Bank of New York find that the relationship between firm and average wage volatility has been more positive over time. They attribute this to a shift in the composition of jobs toward those with bonus pay. But the measure of average wage volatility here masks the variation in worker characteristics.

Juhn and her coauthors find that higher-wage workers in manufacturing and professional services are the ones who experience the most volatility in earnings. Revenue fluctuations to a manufacturing firm have an insignificant effect on the bottom 20 percent of its workers, but the top 5 percent of that firm’s workers do have a positive elasticity of nearly three percent. That is, their wages will respond to a 10 percent gain (or loss) in firm revenue by moving up (or down) by 3 percent. The pattern is more pronounced for professional service firms. A 10 percent change in their revenue has no effect for the bottom 20 percent of workers’ earnings, but for the top 5 percent of workers, wages will respond to shocks at a rate of 9 percent.

One limitation of the study is that it focuses solely on workers who continue to be employed at the same firm after the demand shock. Unique shocks to firm outcomes can potentially affect the earnings volatility of those who stay, yet they also affect the likelihood that employees stay at their current job. The lack of movement in earnings for the bottom fifth of workers may be a result of a drop in employment or layoffs rather than the firm providing full “wage insurance” to its workers.

The researchers see the small estimates of performance transmissions to workers’ earnings as supporting the claim that firms are partially insuring their workers and insulating employee wages from shocks to the demand they face. For the workers who stay, being able to anticipate earnings can be enormously important, especially low-wage workers who lack the tools and resources to deal with unstable earnings.

But the authors also note that shocks to local labor markets or employment may in fact be more important than firm performance to workers’ earnings volatility, suggesting that whether or not a worker is still employed may matter more for maintaining a stable income than changes in firm revenue.

Can women’s “sagging middle” help explain the fall in U.S. labor force participation rates?

Labor force participation rates in the United States have been falling since 2000. Just 62.5 percent all Americans were in the labor force (defined as either working or actively looking for work), the lowest rate in nearly 30 years. This trend has many policymakers, including President Trump, concerned. The slowdown is the main factor behind the Congressional Budget Office’s prediction that the U.S. economy will grow substantially more slowly over the next decade than it has in recent history, at a rate of about 2 percent per year as compared to 3.2 percent annual average growth in adjusted GDP between 1950 and 2015. Policymakers looking to accelerate economic growth need to take the causes and consequences of the declining labor force participation rate seriously.

Much of the overall decline in labor force participation can be explained by the aging of the U.S. population, as large cohorts of older workers retire and smaller cohorts of younger workers take their place. But the graying of America can’t explain away the decline in the labor force participation rate for prime-age workers ages 25-54, which has been falling since 2000. Key to understanding the overall decline in labor force participation may be the decline in women’s labor force participation, which is often overlooked in the national conversation.

Rising labor force participation rates among prime-age women was a key factor driving up overall labor force participation rates during the second half of the 20th century, and thus a key driver of economic growth. But, beginning around 2000, women’s labor force participation rates stalled out, and, as a result, the overall labor force participation numbers began their downward slide. Moreover, while men’s labor force participation rates have been flat or falling across other wealthy economies, the dip in labor force participation rates among American women since 2000 is unique—the United States is one of only seven of 35 OECD countries with a declining prime-age female labor force participation rate.

A new Journal of Economic Perspectives paper from Claudia Goldin of Harvard University and Joshua Mitchell of the U.S. Census Bureau provides some compelling new evidence for those looking to understand the causes of declining prime-age labor force participation. The authors focus their analytic lens on prime-age women, providing a careful analysis of changes in women’s labor force participation from the 1950s through the present. Using multiple datasets, including multiple survey data sources matched to administrative data on Social Security earnings records and W-2s, the authors show that delayed marriage and childbirth has had a profound impact on women’s employment patterns over time. The delay in marriage and childbirth, they suggest, has fundamentally shifted the trajectory of women’s labor force participation over the life cycle.

Women born prior to 1940 had very low labor force participation rates in their mid-20s through their mid-30s, presumably because many mothers delayed labor force participation until their children were no longer young. Beginning with the cohort born in the 1940s, more women entered the labor force in their 20s, and the share of women in the labor force increased steadily until beginning to taper when the women hit their early 50s. But, beginning with cohorts born in 1960, a distinct “sagging middle” emerges: Women work from their mid-20s through their early 30s, but a substantial share exit the labor force in their mid-30s through their mid-40s.

Goldin and Mitchell argue that this “sagging middle” comes from the delay in childbirth, which they attribute to women’s rising human capital attainment and the “power of the Pill” (oral contraceptives). While most of these women who leave the labor force in their 30s and 40s rejoin in their mid-40s, this “sagging middle” provides a clue as to why overall women’s labor force participation numbers have been declining in recent years.

The new problem of the sagging middle is particularly acute for college-educated women, whose labor force participation levels are higher than their non-college-educated peers, but for whom this mid-career detachment from the labor force seems to have lasting implications for labor force participation. Women’s labor force participation rates have always dipped in the years following the birth of a child. But Goldin and Mitchell find that while participation rates for earlier cohorts fully recovered following a dip in the 10 years following childbirth, newer cohorts of college educated woman are not recovering to their pre-birth participation rates.

In fact, the rates of labor force participation for six or more years following the birth are lower for the most recent observable birth cohort than for the previous cohort. All of this suggests that college-educated women are less likely to work following the birth of a child than in the past, which has the potential to drag down the overall labor force participation rate.

A wide range of policy solutions could go a long way to increasing the labor force participation rate for women with children, including those with college degrees—many of whom would likely have a non-negligible impact on fathers’ labor force participation as well, if designed properly. For instance, multiple studies suggest that job-protected and paid leave will increase women’s labor force participation, as would policies such as flexible work arrangements that could help stave off women quitting their jobs during pregnancy.

Yet Goldin and Mitchell caution that life-cycle labor force participation rates for women in the United States and the United Kingdom look remarkably similar, despite the absence of paid leave in the former and a protected and paid parental leave policy in the latter. In contrast, life-cycle women’s employment patterns in France and Denmark have continued to increase with age, suggesting that the lower cost and higher quality of childcare might be the more important of the two for making a noteworthy difference in women’s labor force participation over the course of a lifetime.

Americans’ feelings about the U.S. economy make sense

Shuttered storefronts in downtown Logan, W.Va.

A common conundrum for economists is the ongoing disconnect between macroeconomic outcomes and how Americans report feeling about the economy. The U.S. economy is growing at a respectable, although lackluster, rate of 1.9 percent; the unemployment rate recently hit an 8 year low of 4.8 percent; and household incomes grew by a record 5.2 percent last year (the latest data we have). Yet public opinion polls report that 54 percent of Americans view the nation as being on the wrong track, and that in early November more people “saw the economy as getting worse than getting better.”

New York Times reporter Neil Irwin offers two alternative reasons for what’s “rotten in many people’s economic lives.” He reports that the economy is either too volatile or it’s not dynamic enough. He notes there is evidence that points in both directions. On the one hand, jobs appear to be more precarious than in the past. But on the other, the economy is creating fewer start-ups and fewer people are moving. The point Irwin is making is that these various conditions don’t show up in the regularly released data.

The assumption embedded in these explanations, however, is that it’s the pattern that matters, not the conditions themselves. If policymakers could reduce turnover among employees and increase the entry of new firms, then workers would not be so frustrated. But is there a logical reason to assume that — all else being equal — more or less employment and business dynamism would create economic stability for workers and their families?

An alternative explanation is that people simply see the U.S. economy on the wrong track because even though the economy is growing, many people don’t see any gains in their own lives. And this explanation definitely doesn’t show up in our regularly produced statistics.

A new data series on economic growth built by economists Thomas Piketty of the Paris School of Economics and Emmanuel Saez and Gabriel Zucman of the University of California-Berkeley seeks to fix this gap in our data. By matching survey data to administrative records and matching that to National Accounts data, such as gross domestic product, the three economists allow policymakers to see how income growth looks across income groups.

They find evidence for why people feel that the economy is on the wrong track. Between 1980 and 2014, average national income per adult grew by 61 percent in the United States. Yet virtually none of that economic growth accrued to those in the bottom half of the income distribution. Over that 34-year period, the average pre-tax income of the bottom half of individual income earners grew by a paltry one percent, after adjusting for inflation. Those at the top gained substantially from economic growth as their incomes rose by 121 percent for the top 10 percent, 205 percent for the top one percent, and 636 percent for the top 0.001 percent.

People aren’t oblivious to this trend. They can tell that they work hard but attaining economic security has become harder to do. If policymakers could track this data alongside the GDP data each quarter, then there would be no question why Americans feel that the economy is on the wrong track. They would learn that GDP grew by 1.9 percent but also who in the United States took home those gains. Policymakers and the public alike then would be able to understand how these gains or lack of gains look for families.

One thing economists and other social scientists know is that families up and down the income ladder struggle in ways some of those in earlier generations did not because they have less time. Many Americans lost the “silent partner” who took care of family life while one adult—typically Dad—was the breadwinner. The combination of dual-earning families and families with only one parent means that very few families—less than one in four—have that luxury today.

Of course, this doesn’t tell policymakers why the gains from growth aren’t being shared. And, so the New York Times’ Irwin’s is asking the right question. Is it that reduced job turnover also reduces a worker’s ability to bargain over the gains of growth? Or, does the stranglehold by established businesses on the entry of new businesses allow those who are already ensconced in jobs to hold on to the gains? Globalization and automation are certainly factors, but we need to know more about why these trends in the United States (but not in many of our major economic competitors) means that workers no longer gain from economic growth.

Must-Read: Richard Baldwin: Trump’s Anachronistic Trade Strategy

Must-Read: Richard Baldwin: Trump’s Anachronistic Trade Strategy: “Trump has aggressively lashed out against globalization…

…appointed the famously protectionist trade litigator Robert Lighthizer to be US Trade Representative. And the other two members of his trade triumvirate – Commerce Secretary-designate Wilbur Ross and White House trade adviser Peter Navarro – are no less protectionist…. Many working- and middle-class Americans believe that free-trade agreements are why their incomes have stagnated over the past two decades. So Trump intends to provide them with “protection” by putting protectionists in charge….

Old-fashioned protectionism will not boost American industrial competitiveness even if it saves a few thousand jobs in sunset sectors…. Ripping up trade agreements and raising tariffs will do nothing to create new, high-paying factory jobs… [but] only inflict further harm on workers…. Twenty-first-century globalization is knowledge-led, not trade-led…. “Knowledge offshoring” is what has really changed the game….

If the Trump administration imposes tariffs, it will turn the US into a high-cost island for industrial inputs…. Instead, the US needs to restore its social contract so that its workers have a fair shot at sharing in the gains generated by global openness and automation…. Over the last two decades… globalization has continued, but the social contract has been torn up. Trump’s top priority should be to stitch it back together; but his trade advisers do not understand this…

Must-Read: Nick Bunker: What’s Behind the Decline in U.S. Interest Rates?

Must-Read: Nick Bunker explains Eggertsson, Mehrotra, and Robbins to us:

Nick Bunker: What’s Behind the Decline in U.S. Interest Rates?: “Eggertsson, Mehrotra, and Robbins decompose the roughly 4 percent decline in the natural rate of interest since 1970…

…The decline in mortality helped push down the natural rate by about 1.8%-points… [as] individuals had to save more for retirement, thus increasing the supply of savings…. Fewer children reduces the demand for loans… [another] 1.8%-point decline…. Slower productivity growth… 1.9%-points…. The increase in government debt… [+]2%-points…. The declining labor share… 0.5%-points… the declining price of capital goods… 0.4%-points)….Secular stagnation might be around for quite a time to come.