Should-Read: Kevin Drum: Is Obamacare Already Dead?

Is Obamacare Already Dead

Should-Read: I think that this from the smart Kevin Drum is largely but not completely wrong.

Remember: if the exchanges fail, then the next steps are either (a) single payer–socialized medicine by the government–or (b) guaranteed access–you go to the doctor or the hospital, they treat you, and it is then their problem to figure out how they cover their costs. The exchanges are the last chance for a market-based health-insurance system. But it is not about any beliefs that market-conservative means are pragmatically and technocratically effective. It is about dissing the Kenyan Muslim Socialist and all his works. And there are enough interest groups on the reality-based side of this to pull their chain, in the Senate at least…

Kevin Drum: Is Obamacare Already Dead?: “Ryan and Trump have been insisting for months that Obamacare is collapsing…. This is ridiculous, of course…

…It’s covering more than 20 million people at a lower cost than originally projected, and by any fair appraisal it’s been hugely successful…. But what happens next?… It’s clear that they’ll do everything they can to undermine Obamacare along the way. In a few months, insurance companies have to decide whether they want to participate in the exchange market in 2018, and I wonder what they’ll decide? The uncertainty is sky high now, and that means they have little incentive to continue. Remember, most insurers swallowed big losses early on in hopes of building a stable, profitable market later. But what’s the point of absorbing losses if it looks like—at best—years and years of chaos ahead?… I wonder. Merely by upending everything and making it clear just how dedicated they are to cutting taxes on the rich and cutting health coverage for the poor, have Republicans already managed to effectively repeal Obamacare without passing a single page of legislation?

Should-Read: Nancy LeTorneau: There Is No Grand Strategy to Repeal Obamacare

Should-Read: Nancy LeTorneau: There Is No Grand Strategy to Repeal Obamacare: “The Congressional Budget Office… released their report…. What we’ve seen from conservatives/Republicans/the White House since then…

…If anyone can see a grand strategy here, I’d like to hear about it:

  1. HHS Sec. Tom Price and OMB Director Mulvaney said you can’t believe what the CBO says.
  2. Speaker Paul Ryan praised the CBO report.
  3. The White House produced a report that was even worse than CBO’s – suggesting that 26 million people would lose coverage.
  4. Someone leaked the WH report to Politico.
  5. Breitbart validated the CBO report by broadcasting the news that Paul Ryan’s plan would result in 24 million people losing their health insurance.
  6. Almost simultaneously, Breibart released a tape from last October in which Ryan said he was abandoning Trump forever and wouldn’t support him.
  7. Trump is telling conservative Republicans that he’ll work with them to make the bill even worse by speeding up the changes to Medicaid and basically saying, “who cares if that makes it less likely to pass the Senate, we’ll deal with that later.”

Let’s note one thing right away. The plan to rally right-wing media around the idea that the CBO report cannot be trusted has completely gone off the rails. When everyone from Ryan to Breitbart to the released White House report are validating it, that simply isn’t going to fly…. The theory that… Bannon is working… to discredit Speaker Ryan… Breitbart has consistently referred to this bill as “Ryan’s plan,” even though the president embraced it as “our wonderful new health care bill” the day it was released…. But then why is Trump working with conservative Republicans behind the scenes to get the bill passed, apparently with an assist from Bannon in dealing with the head of the Freedom Caucus, Rep. Mark Meadows (per Politico)?… I’m going to assume that the error in my thinking is assuming that there is either some grand strategy for passing Obamacare repeal or fighting the factional war…. The easier position to defend is that this is a party that doesn’t know how to govern and it’s being exposed for its inadequacies. The silver lining is that it could be good news for the 24 million people who want to keep their health insurance.

Must-Read: Thomas Hoenig: Basic Principles of Banking: Hoenig on Restoring Glass Steagall

Must-Read: Successful financial regulation is a matter of well-known and well-understood basics: blocking and tackling:

Thomas Hoenig: Basic Principles of Banking: Hoenig on Restoring Glass Steagall: “With each financial crisis new regulations are added to an already long list of rules…

…Even so, the industry repeatedly finds itself tangled in financial crisis, struggling to avoid collapse and economic ruin. This happens despite assurances that the industry and its supervisors have become more sophisticated in their analyses and smarter in their decisions. However, there is compelling evidence that keeping with simple but well-tested principles can serve the industry, supervisors, and the public best:

  1. Underwriting standards and asset quality should be systematically reviewed and tested, first by the firms and then checked by the supervisor.

  2. Better disclosure of results will improve performance; it almost always does.

  3. Separating commercial banking and its inherent safety net from broker-dealer and proprietary trading activities will diminish conflicts of interest and abuse of the safety net….

  4. Finally, better capitalized is not the same as well capitalized, and it’s important to acknowledge the difference.

  5. Insisting that bank ownership provide funding—capital—commensurate with the bank’s risk appetite is the most fundamental step for assuring that the banking system is a contributor to economic growth.

I would add that limiting the optionality of the real decision makers is perhaps the most important: their payoffs should not be too convex…

Changing sources of inflationary pressures in the United States

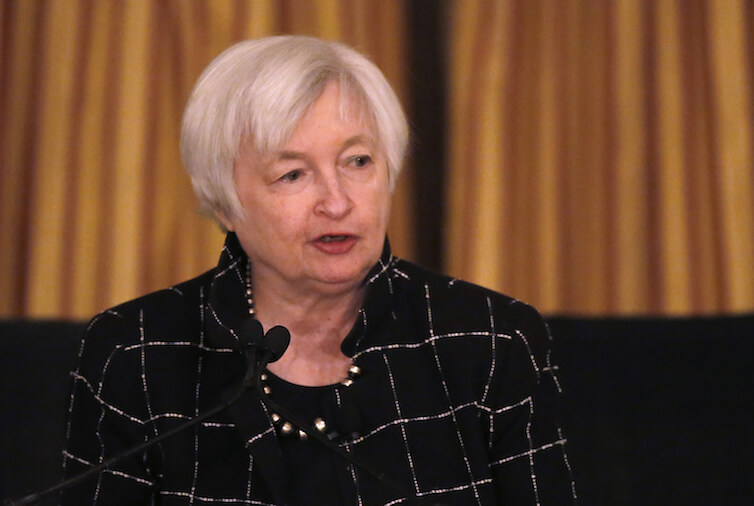
Federal Reserve Chair Janet Yellen addresses the Executives’ Club of Chicago.

What drives inflation in the United States today is a $19 trillion question. The Federal Open Markets Committee is wrapping up its March meeting and is almost certain to announce an increase in short-term interest rates. This move will come even though inflation, measured by the central bank’s preferred measure—the Personal Consumption Expenditures index—has been below the Fed’s 2 percent target for almost five years. What view of inflation and its determinants would lead to such a decision? Does that view make sense? Perhaps not.

The Federal Reserve’s outlook on inflation seems to be best explained by the Phillips Curve, or more precisely by the so-called expectations-augmented Phillips Curve. That curve shows an inverse relationship between unemployment and inflation: If unemployment goes down, then inflation goes up and vice versa. The augmented version accounts for inflation increasing or decreasing if households, businesses, and investors change their expectations of future inflation. This view squares with a prominent speech by Fed Chair Janet Yellen, in which she lays out a Phillips Curve view for an increase in rates as the unemployment rate hovers near some estimates of the long-term unemployment rate. The Federal Reserve’s view, in short, is that inflation is tied to changes in unemployment.

New research challenges the view that changes in the unemployment rate are an important indicator of future inflation rates. The paper by a group of five economists presented at the U.S. Monetary Policy Forum earlier this month finds that while unemployment has a statistically significant impact on inflation, the size of the impact is not very large. Changes in inflation expectations end up not having a statistically significant impact at all.

This is not to say that inflationary expectations are unimportant. As economists Stephen Cecchetti of Brandeis University and Kermit Schoenholtz of New York University’s Stern School of Business (two of the paper’s authors) note in a blog post, this result actually shows the importance of inflationary expectations. By credibly convincing the public that it will keep inflation low and stable, the Federal Reserve itself may have flattened the Phillips Curve. A flatter curve would mean that changes in the unemployment rate would result in much smaller changes in inflation.

One key policy implication of the current Phillips Curve is that policymakers today should be more concerned with the level of wage growth, not the changes in wage growth, when thinking about inflation. This “accelerationist” take on inflation, however, might not be the correct one at this point. In fact, the current relationship is a bit of a return to the Phillips Curve of the 1960s.

The paper by Cecchetti, Schoenholtz, and their three coauthors also has another important implication. The one thing they do find that influences inflation in the period since 1984 is past inflation. In other words, there’s a slowly moving trend of inflation, and that trend is going to be a good estimate of what happens next. A slow-moving trend would mean that to get inflation back to the Fed’s 2 percent target in the long run would require letting inflation overshoot 2 percent by a bit. It would also mean that pulling on the brakes with inflation below 2 percent makes it less likely inflation will get back to its target.

An acclerationist Phillips Curve view of inflation would have policymakers think that inflation is bound to increase significantly soon, with the unemployment rate so low. In other words, it’s a view that would have the Federal Reserve increase rates despite weak wage growth and an inflation rate that’s not yet at target. This view might be validated by events, but there’s quite a bit of cause for skepticism.

Correction: Edits to the fourth and fifth paragraphs to clarify what the retro feature of today’s Phillips Curve is.

Should-Read: Dan Alpert: The Case for Aggressive Public Infrastructure Spending

Should-Read: Dan Alpert looks at the guts of the labor market in the housing sector and sees a “scissors crisis”: It is not that a labor shortage from a limited supply of skilled construction workers is pushing up wages and prices in the housing sector. Instead, slack demand is keeping contractors from being able to profitably offer construction workers the compensating differentials they need to make it sensible for them to supply labor to the sector:

Dan Alpert: The Case for Aggressive Public Infrastructure Spending: “There is substantial slack in the U.S. economy…

  • A substantial change in this recovery relative to earlier recoveries:
    • Over 60% of net jobs in Low-Wage/Low-Hour sectors
    • Rotation out of LWLH expected long ago
    • Nowhere to be seen
    • Dominance of LWLH contributing substantially to slowdown in productivity growth
  • Perceived labor shortages related little to robust demand:
    • Related to low margins in construction
    • Hence need to hire construction workers at average service-sector wage for profitability
    • Not labor shortage in sense of inability to hire–rather inability to pay a premium (and remain profitable)
  • Job openings still openings “at a price”
    • Price is wage less than required for compensating differential
    • End demand still too weak to make offering higher wages profitable
  • The private sector has done all it reasonably can
    • Yet the U.S. labor market remains a shadow of its former self
  • IT’S TIME TO REBUILD AMERICA

NewImage NewImage NewImage NewImage NewImage NewImage

A potentially new and rising concern: inflation inequality in the United States

One dollar bills in a tip jar at a car wash in Brooklyn, NY.

The rich are different from you and me. They have different consumption baskets.

At least that is the tentative conclusion that some scholars are making in their recent research on the differences in consumption and prices across the U.S. income distribution. Differential inflation rates might not sound like the most exciting topic in the world, but differences in changes in prices and how these differences would impact the level of inequality, the relative gains from increased international trade, and the value of government transfer programs are meaty topics.

In a paper released today as part of the Equitable Growth working paper series, Stanford University post-doctoral fellow Xavier Jaravel looks at how changes in the income distribution affect differences in product innovation. In other words, Jaravel wants to see if more income at the top means more innovation in products that high-income people buy. He ends up finding that’s exactly what happens, with the result being an inflation rate for high-income households about 0.65 percentage points per year lower than for low-income households.

Another paper, released by the National Bureau of Economic Research earlier this year finds very similar results. Looking at similar data to Jaravel, Benjamin Faber and Thibault Fally of the University of California, Berkeley find a significant difference in the kinds of goods purchased by households in the top 20 percent by income versus those in the bottom 20 percent. Households in the top one-fifth consume more goods from large companies. High-income households tend, for example, to buy more brand name goods than low-income households. The authors say this happens because high-income consumers value higher-quality goods, and large firms can produce a large amount of high-quality goods more cheaply than smaller firms.

This difference ends up having some relevance in certain situations. If income starts flowing more toward high-income households, for example, then companies will have an incentive to increase the quality of their goods. Since larger firms are better at quality production, the prices at large firms will be relatively lower. This would mean that the inequality of inflation-adjusted income would be even larger due to a lower inflation rate for high-income households.

Similarly, if international trade is liberalized, more international competition boosts the share of imported goods, which, in Faber and Fally’s model, will tend to be from higher-quality larger firms. The result is that the richer gain more from the price declines brought on from trade, making the consumer benefits from international trade less progressive than previous studies had indicated.

If both these papers are generally correct, then the differences in inflation also have another implication. If the prices faced by those at the bottom and middle of the income distribution grow faster than the average prices reported in the Consumer Price Index or the Personal Consumption Expenditure price index, then U.S. government safety-net programs should grow at a faster pace. The growth of many programs is tied to overall inflation measures, so they may not be keeping up with the pace of inflation that low-income households actually experience.

Of course, such adjustments should wait until we have far more evidence on this possibility. Given the numerous ways that inequality in inflation could influence our understanding of the economy, this is evidence policymakers and researchers should be very interested in.

Fiscal policy stabilization: Purchases or transfers?

Download File
031417-WP-fiscal-policy-stabiliation-purchases-or-transfers

Read the full PDF in your browser

Author:

Neil R. Mehrotra, Assistant Professor of Economics, Brown University and Visiting Junior Scholar, Federal Reserve Bank of Minneapolis


Abstract:

Both government purchases and transfers figure prominently in the use of fiscal policy for counteracting recessions. However, existing representative agent models including the neoclassical and New Keynesian benchmark rule out transfers by assumption. This paper explains the factors that determine the size of fiscal multipliers in a variant of the Curdia and Woodford (2010) model where transfers now matter. I establish an equivalence between deficit-financed fiscal policy and balanced-budget fiscal policy with transfers. Absent wealth effects on labor supply, the transfer multiplier is zero when prices are flexible, and transfers are redundant to monetary policy when prices are sticky. The transfer multiplier is most relevant at the zero lower bound where the size of the multiplier is increasing in the debt elasticity of the credit spread and fiscal policy can influence the duration of a zero lower bound episode. These results are quantitatively unchanged after incorporating wealth effects on labor supply.

The unequal gains from product innovations: Evidence from the US retail sector

Download File
031417-WP-unequal-gains-from-product-innovations

Read the full PDF in your browser

Author:

Xavier Jaravel, Postdoctoral Fellow in Economics, Stanford University and Stanford Institute for Economic Policy Research


Abstract:

Using detailed barcode-level data in the US retail sector, I find that from 2004 to 2013 higher-income households systematically experienced a larger increase in product variety and a lower inflation rate for continuing products. Annual inflation was 0.65 percentage points lower for households earning above $100,000 a year, relative to households making less than $30,000 a year. I explain this finding by the equilibrium response of firms to market size effects: (A) the relative demand for products consumed by high-income households increased because of growth and rising inequality; (B) in response, firms introduced more new products catering to such households; (C) as a result, continuing products in these market segments lowered their price due to increased competitive pressure. I use changes in demand plausibly exogenous to supply factors from shifts in the national income and age distributions over time to provide causal evidence that increasing relative demand leads to more new products and lower inflation for continuing products, implying that the long-term supply curve is downward-sloping. Based on this channel, I develop a model predicting a secular trend of faster-increasing product variety and lower inflation for higher-income households, which I test and validate using Consumer Price Index and Consumer Expenditure Survey data on the full consumption basket going back to 1953.

Should-Read: Paul Demko: White House analysis of Obamacare repeal sees even deeper insurance losses than CBO

Should-Read: Paul Demko: White House analysis of Obamacare repeal sees even deeper insurance losses than CBO: “A White House analysis of the GOP plan to repeal and replace Obamacare shows even steeper coverage losses than the projections by the Congressional Budget Office…

…according to a document viewed by POLITICO on Monday…. 26 million people would lose coverage over the next decade, versus the 24 million CBO estimates. The White House has made efforts to discredit the forecasts from the nonpartisan CBO…. 17 million for Medicaid, six million in the individual market and three million in employer-based plans. A total of 54 million individuals would be uninsured in 2026 under the GOP plan, according to this White House analysis. That’s nearly double the number projected under current law…

Must-Read: Mark Thoma et al.: The Republican American Health Care Act

Must-Read: Mark Thoma et al.: The Republican American Health Care Act


Mark Thoma: Why the Republican Health Care Plan Is Destined to Fail: “Healthcare often involves large, unexpected expenses…

…An individual may not have saved enough or be able to borrow enough…. In the face of such uncertainty–not even knowing who will need healthcare and when–pooling money into an insurance fund and then sharing the risk… is… natural…. But health insurance markets have… “adverse selection.” When people are pooled together in an insurance fund some will have very high expected medical costs…. For… [those more likely to remain] healthy, that… [can be] a bad deal–the premiums are more than their expected health spending…. Many… won’t purchase insurance (and the emergency room is available for serious problems, and if the bill is big enough someone else will end up paying). That leaves more people with high expected health costs in the insurance pool, leading to higher premiums and more dropouts, a process that continues until only the highest cost patients are left and the premiums are unaffordable.

One way to stop this spiral to market collapse is a mandate that keeps healthy people in the insurance pool. The mandate in… the Republican proposal… creates a [stronger] incentive to go without insurance…. It’s hard to see how this will work….

But the most problematic aspect of delivering healthcare in the private marketplace is that consumers do not have the information they need to make informed healthcare choices…. In this regard, Professor Arrow made an interesting comment in an interview in 2009….

The market won’t work—it doesn’t work well in the health context. But something else supplements the market, and the thing I put stress on in the paper are the elements that put a non-economic influence on the market: professional commitments to provide a service, to engage in services that aren’t self-serving. Standards of caring decided by non-economic actors. And one problem we have now is an erosion of professional standards. In a way, there is more emphasis on markets and self-aggrandizement in the context of healthcare, and that has led to some of the problems we have today.

Another way to overcome the information problem is to let an informed agent make decisions on your behalf…. HMO’s…. But HMOs make less money when consumers receive more care, and consumers do not trust HMO-type institutions….

Once the need for government involvement to overcome market failures is accepted, and to me, it seems impossible to deny, the question is how well a particular healthcare proposal addresses these problems…. The Republican plan does not even seem to recognize the full extent of the problems in healthcare markets, and when it does, the remedies are far from adequate. Anyone who is serious about a delivering broad-based, affordable healthcare insurance should give it two bigly thumbs down.


Edwin Park: CBO: 24 Million People Would Lose Coverage Under House Republican Health Plan: “The plan… would effectively end the ACA’s Medicaid expansion starting in 2020…

…repeal the ACA’s marketplace tax credits and subsidies, substituting a highly inadequate tax credit in 2020, and immediately end the ACA’s individual and employer mandates to buy and provide health coverage…. The plan would retain most of the ACA’s market reforms and consumer protections…. [The plan has] a deeply flawed, ineffective alternative to the individual mandate….

Federal Medicaid spending would be cut by $880 billion or 17.6 percent over the next ten years, relative to current law…. CBO’s estimate of a 24 million increase in the number of uninsured under the House bill is only 8 million lower than CBO’s 32 million estimate of the ACA repeal bill that President Obama vetoed in January 2016…. At the time, congressional Republican leaders dismissed the 32 million estimate because it didn’t account for their “replacement” coverage provisions, which they hadn’t yet agreed upon…. CBO estimates that this “replacement” bill would offset only 25 percent of the coverage loss expected under the earlier repeal bill…


Jacob Leibenluft: [CBO: Millions Would Pay More for Less Under House GOP Health Plan][]: “While dismissing CBO’s analysis, Republicans have pointed to one of its numbers…

…that average individual market premiums will fall by 10 percent by 2026…. They… misunderstood…. The premium decrease… is the average change in the sticker price of health insurance, without accounting for the House plan’s large reductions in tax credits…. Average premiums fall, [but] what many people actually pay will rise…. A 40-year-old with an income of $26,500… could buy a health plan in 2026 with a sticker price somewhat less than under current law, but would have to pay $700 more in premiums…. Despite promises by President Trump and others, deductibles and other cost-sharing would rise substantially—further increasing how much families pay out of pocket….

The drop in average premiums occurs partly because older adults are likelier to lose coverage because they can no longer afford it, removing them from the average. Average premiums would rise 20 to 25 percent for 64-year-olds, while dropping 20 to 25 percent for 21-year-olds…. Unsurprisingly, older people would be the most likely to find individual market coverage unaffordable. “A larger share of enrollees in the non-group market,” CBO concludes, “would be younger people and a smaller share would be older people.” That fact alone will reduce average premiums because older people have higher health costs and premiums than younger people…


Alvin Chang: The CBO’s nonpartisan report on the Republican ACA replacement plan, explained in 6 charts: “It’s an attack on the poor… a devastating report for the Republican plan, and it can be summed up in one chart:

NewImage

[Plus:]

NewImage NewImage NewImage NewImage NewImage