U.S. income data for 2024 shows the top 10 percent accrued the highest share of income since 2000

Key Takeaways
- The share of Personal Income accrued by the top 10 percent of U.S. households is the highest since U.S. Bureau of Economic Analysis started tracking this statistic in 2000. Their share of disposable personal income is also at its highest level.
- From 2019 to 2024, income inequality was little-changed, with the top and bottom groups of households seeing mild increases while the upper 40 percent saw their share of income sink. Wages increased faster for the bottom 90 percent of households over this period, but business and asset income at the top increased quickly as well, so inequality did not decrease.
- What this means for growth: Higher Personal Income inequality can lead to lower economic growth through a variety of pathways. While the COVID-19 pandemic period saw strong wage growth for bottom 90 percent households, that change is so far not large enough or sustained enough to reduce overall income inequality in the United States.
Overview
Today, Equitable Growth updated the U.S. Inequality Tracker through 2024 following the release of new data last week by the U.S. Bureau of Economic Analysis. The data show that the share of income earned by the top 10 percent of U.S. households increased between 2000 and 2024 to the highest level recorded, matching the level recorded in 2022. This group’s share of disposable personal income, which subtracts taxes paid from income, is also currently at the highest level recorded in this dataset, at 36 percent.
Using the U.S. Inequality Tracker, which analyzes trends over a minimum of 5 years, users can now see how inequality has changed compared to the pre-pandemic economy in 2019. Shares of income varied substantially during this time due to high government transfers and a volatile economic environment but settled very close to where they were in 2019. The top 10 percent and the bottom 50 percent of households made modest gains over the past 5 years at the expense of the upper 40 percent (the 50th to 90th percentiles) of households. The top 10 percent of households increased their share of income by 0.4 percentage points, the largest gain among the three groups. (See Figure 1.)
Figure 1
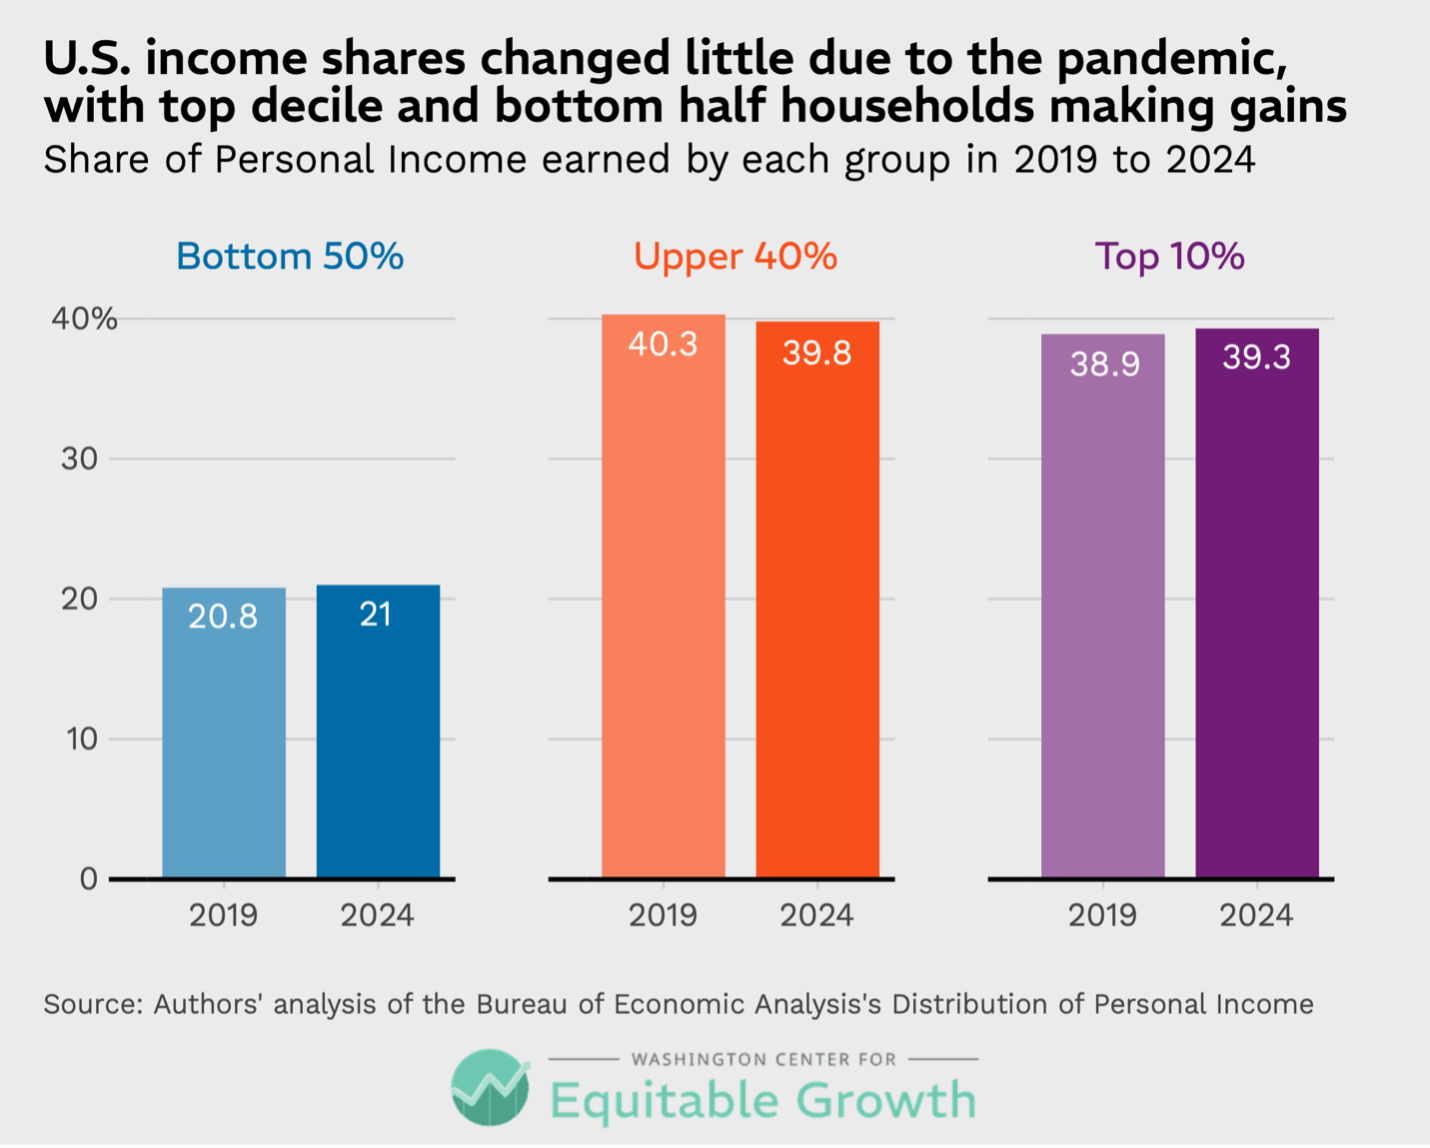
These changes in income shares largely continue the pre-pandemic trends that I wrote about at the launch of the U.S. Inequality Tracker in 2025. In the 21st century, the top 10 percent of households generally experienced slowly rising incomes, with a total gain of 2.1 percentage points between 2000 and 2024. The bottom 50 percent of households also made gains, although the total increase in income share for this group is far more modest, with a gain of just 0.3 percentage points between 2000 and 2024. The upper 40 percent of households lost 2.4 percentage points of income share in this time period.
These trends are largely attributable to slow wage growth for bottom 90 percent of households since 2000. There was some hope among economists and policymakers that the hot U.S. labor market of the post-pandemic period would boost wages at the bottom and reduce income inequality. The labor economist Arindrajit Dube at the University of Massachusetts, Amherst, for example, used nonsupervisory wages from the Current Employment Statistics survey to show that lower-wage workers were seeing faster wage growth in the post-pandemic period.
The new BEA data confirms Dube’s work. The bottom 90 percent of households experienced wage growth significantly faster per year during the pandemic period, between 2019 and 2024, than they had in the period between 2000 and 2019. Incomes in the bottom 90 percent grew about half a percentage point faster per year than they did between 2000 and 2019. In contrast, the top 10 percent of households registered wage growth about 0.7 percentage points slower per year from 2019 to 2024, compared to 2000 to 2019. (See Figure 2.)
Figure 2
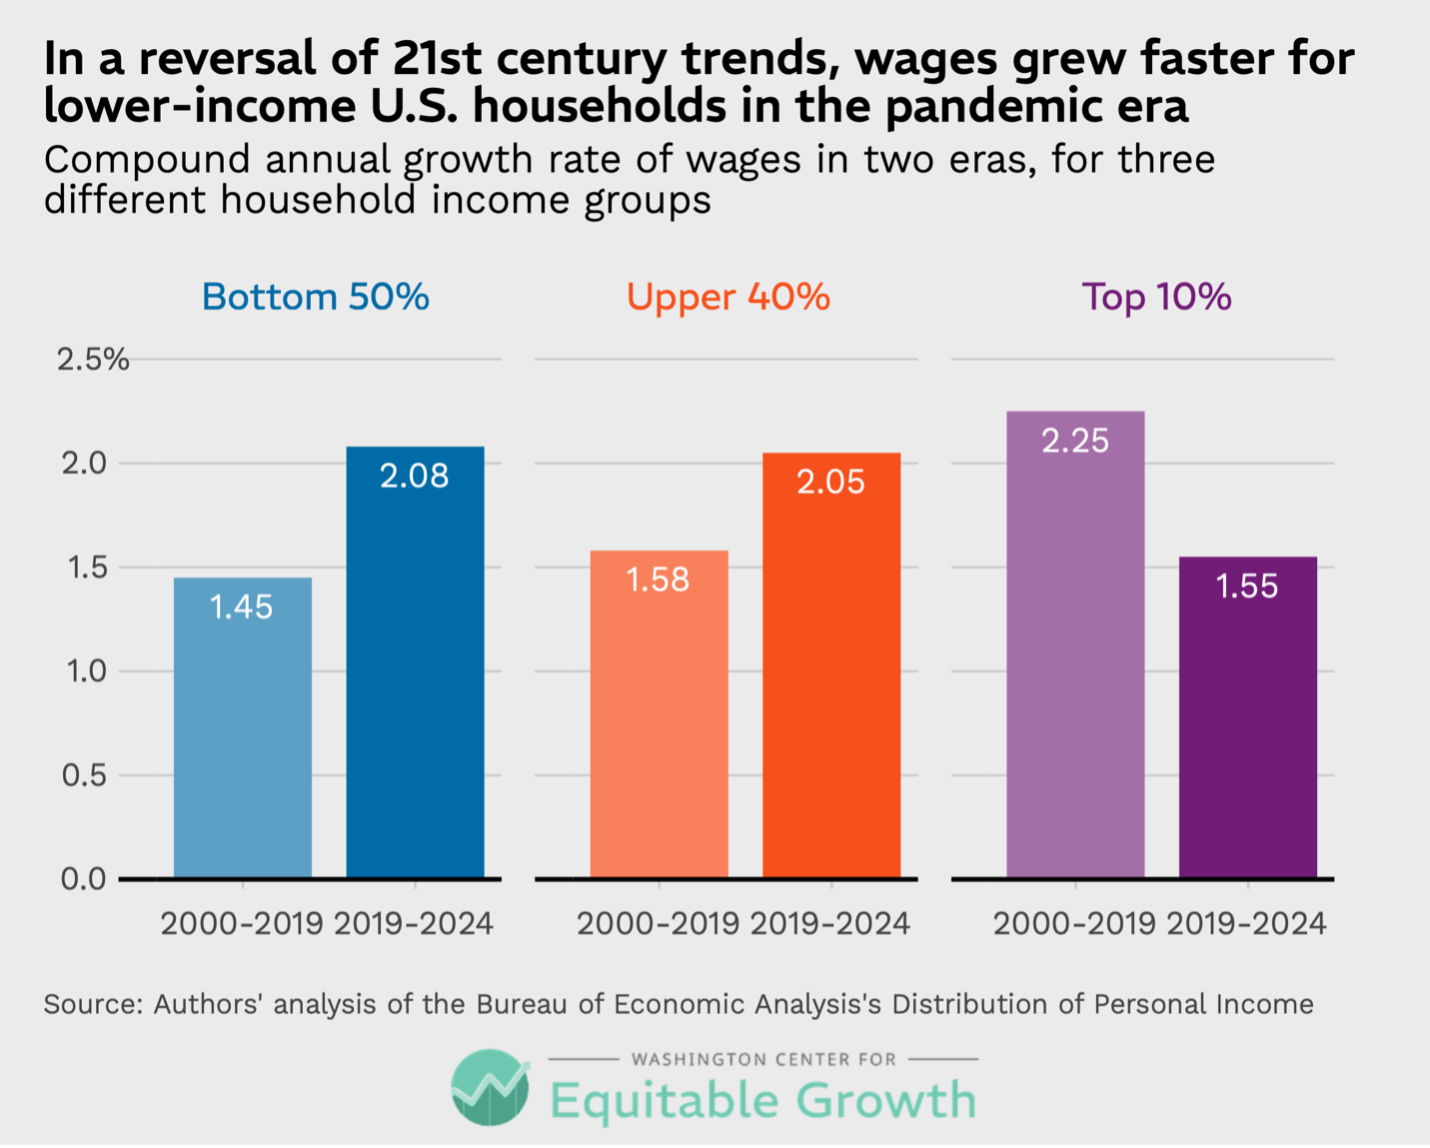
This did not, however, result in lower income inequality. That is because the top 10 percent of households experienced surging interest and dividend income over the same period, growing by nearly 4 percent per year. Likewise, private business income for these households was up 2.7 percent per year and stood in stark contrast to the smaller businesses run by the upper 40 percent of households, where income shrank by 3.8 percentage points per year. This collapse in business income for the upper 40 percent largely explains why that group lost ground in the pandemic era.
Although there are some glimmers of good news in recent BEA data on inequality, these new numbers expose the harsh mathematics of income inequality in the United States. A hot labor market makes little difference unless it can be sustained for a long period of time. The concentration of income-generating financial assets held by the top 10 percent of U.S. households and the dominance of the top 10 percent of private businesses mean this group can increase its share of income even as wages for other households rise.
Moreover, cuts made to government transfer programs such as the Supplemental Nutrition Assistance Program and Medicaid in President Donald Trump’s One Big Beautiful Bill Act in 2025 will drag down incomes for the bottom 50 percent of households, while falling real wages (after accounting for inflation) will disproportionately harm the upper 40 percent of households, which receive the vast majority of their income from wages.
In short, absent significant change, the top 10 percent of U.S. households are likely to continue making significant income gains.
Did you find this content informative and engaging?
Get updates and stay in tune with U.S. economic inequality and growth!


Stay updated on our latest research