Key Takeaways
- Determining the cut-off point for being considered part of the top 0.1 percent of wealth holders or income earners in the United States—categories of special interest to tax researchers, policymakers, and advocates—often depends on which data source is used and can turn on subtle definitional differences and other methodological assumptions.
- There is rough consensus around the measurement of wealth. All tax revenue scorers now use the Survey of Consumer Finances to model the distribution of wealth. Yet this survey becomes less accurate at extremely high levels of wealth and thus may be misleading as a guide to how many U.S. households are identified at particular wealth thresholds. Some academic researchers have devised other ways to measure wealth based on tax records, leading to different thresholds.
- Differing income definitions, differing processes for aging income into current years, and differing methods for assembling the distribution of income all result in a high level of variation in income estimates for specific percentile thresholds in the distribution. The definition of income used by academics and tax modeling organizations, for example, is very different from what most laypeople understand as constituting their incomes. Income thresholds reported by tax modelers add streams of income such as employer 401(k) retirement income matches and employer-provided health insurance. Equivalizing by household size also makes it difficult to interpret income thresholds.
- Common income surveys such as the Current Population Survey do not do a good job of capturing extremely high-income households. Additionally, administrative data that does capture high-income households are released on a significant time lag.
- What this means for growth: While there is strong evidence that targeted tax increases on the rich can improve the fiscal situation, combat inequality, and spur equitable growth, picking thresholds for income and wealth taxation is imprecise. Most proposals target very small slices of the U.S. population. How much revenue is generated and how the U.S. economy is impacted are both hard to predict and similarly imprecise.
Overview

Wealth and income inequality are an ongoing area of interest for policymakers. In particular, the rise of the richest of the rich—not just the top 1 percent, but also the top 0.1 percent and even higher—has recently captured the imagination of policymakers, as evidenced by state1 and federal2 tax proposals targeting this group.
Many of these proposals use income or wealth thresholds to determine tax rates. The Make Billionaires Pay Their Fair Share Act,3 for example, taxes all household wealth exceeding $1 billion. The Five & Dime plan4 imposes a 5 percent tax for household wealth higher than $50 million and a 10 percent tax for household wealth exceeding $250 million. The amount of revenue these proposals collect depends critically on how many U.S. households register above these thresholds and how much wealth they hold or income they earn.
This report, which is accompanied by an Equitable Growth factsheet, aims to help policymakers make sense of the wealth and income thresholds they see in revenue scoring and other datasets—thresholds that often conflict with each other, using different definitions of income, different units of analysis, and different datasets. Revenue scoring is also impacted by behavioral assumptions about the amount of tax avoidance and tax evasion in which households engage, their preferences for substituting leisure for work, and other assumptions. This report focuses purely on measurement of thresholds. It explains why measuring both income and wealth are more difficult than might be expected and why estimates from different sources can be subtly, or dramatically, different.
 post
post
This report tackles wealth and income separately. Each section reviews cut-offs for inclusion in the top 0.1 percent of income and wealth holders and other categories of extreme wealth and income. Each section also provides some guidelines for using these cut-offs when thinking about policymaking. And each section closes with recommendations for data collection and research on these groups.
Let’s turn first to wealth in the United States.
Wealth in the United States
Measuring wealth and defining top wealth groups
There is a general consensus on wealth measurement in large part because everyone agrees on the definition of wealth—namely, that it is a person’s net worth, or the total value of their assets minus the total value of their liabilities. There are disputes—such as whether unfunded defined benefit pensions should be included—but these are relatively minor compared to disputes over the definition of income discussed in the next section.
There are three methods that researchers have used to measure wealth concentration in the United States. First, the Federal Reserve conducts the Survey of Consumer Finances5 every 3 years. The survey is comprehensive, with trained surveyors who sometimes spend hours reviewing financial records with respondents. Most importantly, it uses a targeted oversample of wealthy households, identified from tax data, that allows analysts to accurately represent the wealth of the top 1 percent—and even the top 0.1 percent. The survey, however, does not reach the very wealthiest U.S. households, so researchers commonly augment it by adding in the wealth of the Forbes 400,6 a list of the 400 wealthiest individuals in the United States compiled annually by Forbes.
The Federal Reserve also produces the Distributional Financial Accounts,7 which use the Survey of Consumer Finances combined with the Federal Reserve’s Financial Accounts of the United States8 to extrapolate the distribution of wealth in recent years, filling in time between the triennial waves of the Survey of Consumer Finances. The Financial Accounts are updated quarterly and provide detail on levels and shares of top wealth groups. They also provide demographic details, breaking wealth out by age, race, education, and birth cohort.
A second approach to measuring wealth concentration is to examine estate tax returns. This is the approach taken by economists Wojciech Kopczuk of Columbia University and Emmanuel Saez of the University of California, Berkeley to examine the history of top wealth shares in the United States.9 They find that the top 1 percent’s share of wealth declined significantly in the mid-20th century. Those shares have since increased but have not returned to levels experienced in the early 20th century. Using estate tax returns to measure wealth is no longer common in the United States because the estate tax exemption has risen greatly in the past 20 years, so these returns cover much less of the population.
The final approach is to capitalize income observed in tax documents. If it is observed, for example, that a taxpayer has $200 in interest income on a bond with an interest rate of 5 percent, this implies that the bond is worth $4,000. UC Berkeley’s Emmanuel Saez and Gabriel Zucman use this approach to create their dataset on wealth inequality since 1913.10 Saez and Zucman assumed that U.S. households across the wealth distribution register similar returns on their investments.
Another study, by economists Matthew Smith at the U.S. Department of the Treasury, Owen Zidar at Princeton University, and Eric Zwick at the University of Chicago, estimates rates of return across households and finds that high-wealth households actually accrue higher returns on their investments.11 This implies that Saez and Zucman overestimated wealth at the top of the distribution.
The reason is a little counterintuitive: If investment rates of return are higher at the top of the distribution, then that means the observed interest income in tax records represents less invested wealth. If one earns $1 at 4 percent interest, then the principal is worth $25, but if one earns $1 at 5 percent interest, then the principal is worth $20. Higher rates of interest at the top of the distribution imply lower amounts of wealth.
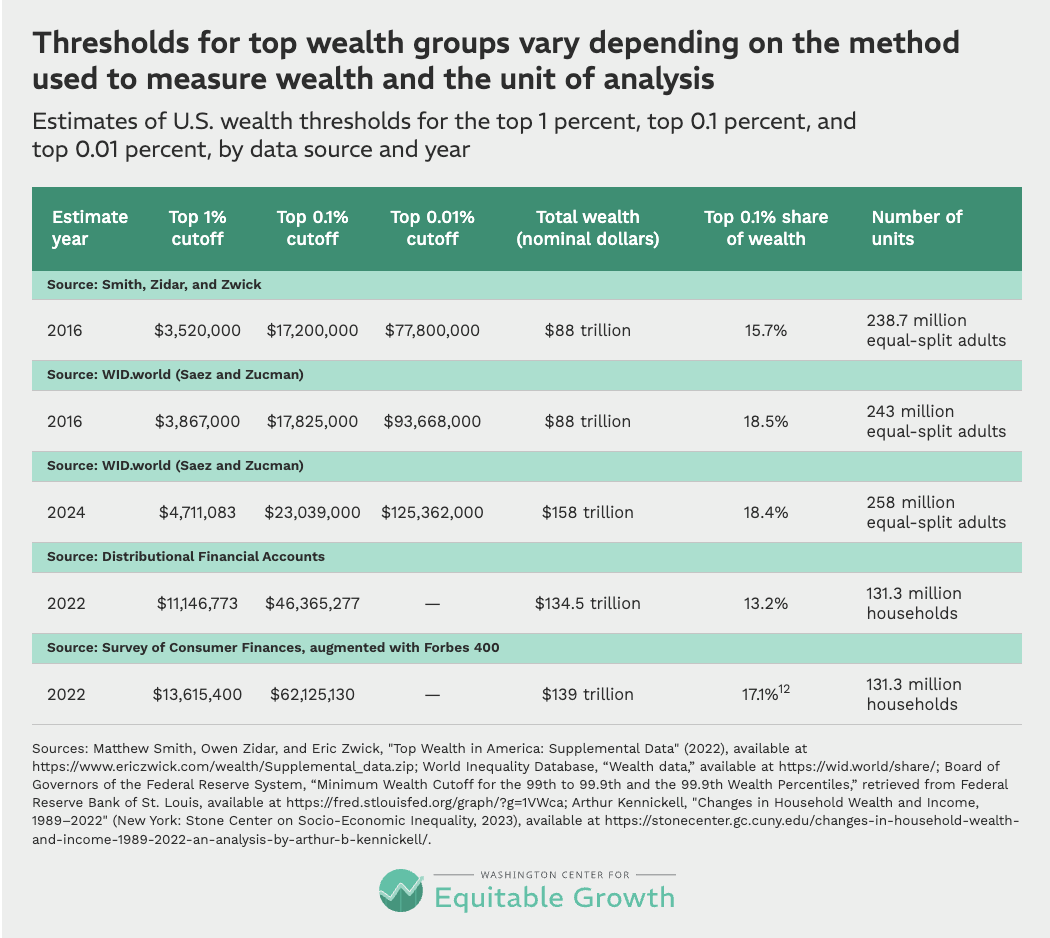
Smith, Zidar, and Zwick’s estimates are for 2016, while Saez and Zucman have updated their estimates through 2024. Table 1 below provides estimates for both years, for comparison with Smith, Zidar, and Zwick. Saez and Zucman revised their methodology after the release of Smith, Zidar, and Zwick’s paper, and the two now mostly agree on thresholds in 2016 for the top 1 percent and top 0.1 percent of the wealth distribution in the United States.
The raw percentile cutoffs from the 2023 Survey of Consumer Finances are also included in Table 1 below. These are much higher than both Saez and Zucman and Smith, Zidar, and Zwick primarily because of the unit of analysis. The two groups of researchers both examine equal-split tax units, dividing wealth among spouses, while the Survey of Consumer Finances examines households, meaning families are seen as one unit. There are around 240 million equal-split individuals in the Smith, Zidar, and Zwick and Saez and Zucman methodology but only 131 million households in the Survey of Consumer Finances. The Distributional Financial Accounts, although based on distributional information from the Survey of Consumer Finances, targets levels of wealth in the Financial Accounts of the United States, which leads to significantly different thresholds for top households. (See Table 1.)12
Table 1
Otherwise, these three main sources of measuring wealth concentration use a very similar definition of wealth. One exception is that Saez and Zucman exclude consumer durables (such as cars) because they think of this category as consumption, not wealth. This definitional difference has very little impact at the top of the distribution, however, and accounts for less than 3 percent of total wealth. Saez and Zucman also exclude unfunded defined benefit pensions, which they argue are promises that are not backed by any actual wealth. Smith, Zidar, and Zwick include these, as do the Distributional Financial Accounts.
Other differences turn on the visibility provided by different data sources. Take trusts as an example. The goal of each measurement methodology is to attribute trust wealth to beneficiaries. The Survey of Consumer Finances relies on self-reporting, and complex trust structures may confuse this issue, especially when trusts benefit several family members—and even these family members may not know what proceeds they will eventually receive from the trust. Saez and Zucman observe recent income disbursements from trusts on tax forms and extrapolate ownership of the underlying trust wealth from those disbursements. But trustees often have discretionary control over making disbursements, and the allocation of income in a single year may not indicate the eventual division of trust wealth between beneficiaries.
Some researchers argue that Social Security wealth should be included in estimates of household wealth. Neither the Survey of Consumer Finances nor the income capitalization methods include Social Security, but the Congressional Budget Office produces estimates of the distribution of wealth based on the Survey of Consumer Finances that account for accrued Social Security wealth.13
As Table 1 shows, Smith, Zidar, and Zwick and Saez and Zucman continue to disagree about wealth at the very top of the distribution. Saez and Zucman have a higher cutoff for the top 0.01 percent (24,000 people) and believe that this group holds a higher share of total wealth. The total amount of wealth held by U.S. households also is similar for these researchers but not identical. Both groups of researchers benchmark their wealth accounting to the Federal Reserve’s Financial Accounts of the United States, whereas the Survey of Consumer Finances simply totals reported wealth from all survey respondents. According to Federal Reserve research, these two aggregates are almost exactly equivalent on average but may differ from each other by as much as 10 percent in any given year. (See Table 2 in this paper.14)
In practice, these different data sources produce similar estimates of the concentration of wealth. The estimates of wealth thresholds, however, can be significantly different, even when they are modified to use the same unit of analysis. There are sources of error in both methods for estimating wealth. In the Survey of Consumer Finances, errors may come from small samples at the very top of the distribution and survey respondents misrepresenting their wealth. And capitalization factors used by Saez and Zucman or Smith, Zidar, and Zwick may be incorrect or may change as the tax code or other features of the financial system change.
Using wealth data to model tax policy
For the purposes of modeling revenue earned from proposed wealth taxes, the Survey of Consumer Finances is the standard. Even Saez and Zucman, who once used their own capitalized income dataset to score wealth taxes,15 have now switched to exclusively using the Survey of Consumer Finances.16
Disagreements over the measurement of wealth therefore have very little to do with variations in revenue estimates from a proposed wealth tax. Rather, these discrepancies in estimates primarily stem from projections of how much tax avoidance and tax evasion will take place under any proposed wealth tax. The rates of avoidance and evasion assumed by different research teams range from as low as 10 percent to as high as nearly 50 percent. Modelers often use tax elasticities, which increase the rate of evasion as the marginal tax rate on wealth increases, so higher rates of taxation will yield higher rates of avoidance and evasion.
Proposed wealth taxes often have very high wealth thresholds to trigger taxation. Two examples are the Five & Dime plan, which would institute a 5 percent tax on household wealth exceeding $50 million and a 10 percent tax on household wealth exceeding $250 million, and Sen. Elizabeth Warren’s (D-MA) Ultra-Millionaire Tax Act,17 which would institute a 2 percent tax on household wealth of more than $50 million. These values both apply to a small number of very wealthy U.S. households. According to the 2022 Survey of Consumer Finances, the $50 million threshold would apply to just the top 0.14 percent, or about 183,000 households. The $250 million threshold in the Five & Dime plan would apply to just the top 0.012 percent, or about 16,000 households.
Both Sen. Bernie Sanders’ (I-VT) Make Billionaires Pay Their Fair Share Act18 and Sen. Warren’s Ultra-Millionaire Tax Act would institute a wealth tax only on wealth exceeding $1 billion. The Survey of Consumer Finances may not be a reliable source of data for wealth this high, but a tabulation of U.S. billionaire wealth in 2025 made by Americans For Tax Fairness, with data from the Forbes 400 list, finds there are 959 billionaires in the United States.19 The Wall Street Journal, using private data from Altrata, has also reported on the number of billionaires in the country,20 finding 1,135 billionaires in total.
Tracking wealth mobility
There is very little evidence on the amount of wealth mobility for U.S. households in the top 1 percent or top 0.1 percent. The Survey of Consumer Finances does not allow for tracking the same households across time, making mobility research difficult.
Some recent survey research suggests that wealth mobility over short periods of time is relatively low.21 A household in the top quintile of the wealth distribution in 2013 had a 70 percent or 79 percent chance of still being in the top quintile in 2015, depending on the survey used. Households that fell out of the top quintile generally slipped down just one quintile. Only 4 percent to 8 percent of these households fell into one of the bottom 3 quintiles.
Downward mobility is a little more common across longer time frames. A team at The Brookings Institution found that U.S. households in the top quintile when in their early 30s had a 53 percent chance of maintaining their position into their late 50s,22 with another 27 percent falling just one quintile.
Using wealth data for policy analysis
For those looking to utilize these approaches to wealth measurement in analyzing tax policy, all the data are available online. For instance, WID.world,23 which hosts Saez and Zucman’s wealth dataset, provides updated estimates using the Saez and Zucman income capitalization methodology and makes it easy to visualize and download data over time. The Distributional Financial Accounts also are easy for nonexpert analysts to access and use. The Federal Reserve provides a couple of data visualizations24 on their DFA landing page, and even more are available on Equitable Growth’s U.S. Inequality Tracker.25
For understanding wealth concentration, the Distributional Financial Accounts’ use of households as the unit of analysis may be more intuitive for policy analysts than the equal-split adult concept used by Saez and Zucman, as well as by Smith, Zidar, and Zwick—all of whom divide wealth between spouses.
Calculating wealth thresholds in the Survey of Consumer Finances requires some statistical knowledge, but these thresholds are generally published by researchers shortly after the release of new survey data.
The future of wealth measurement in the United States
Although the Survey of Consumer Finances is not perfect, it is one of the best surveys of wealth in the world. The only way to collect even better wealth data is to implement administrative wealth registers, such as those found in Nordic countries.26 These generally exist in countries that have wealth taxes or those that previously had wealth taxes and kept the administrative data collection once wealth taxes were abolished. A great deal of research that would otherwise be impossible, including recent work attributing all corporate profits to the owners of equities as accrued capital gains,27 is impossible without that administrative data.
Similarly, the act of instituting a wealth tax in the United States would produce a great deal of useful administrative data for studying the wealthiest U.S. households. This has led some analysts to jokingly suggest that the United States should levy a negligibly small wealth tax simply to get the data. This would greatly improve researchers’ ability to understand the fortunes at the very top of the wealth distribution, where there currently is the most uncertainty.
Alternately, the National Academies of Sciences, Engineering, and Medicine put out a report on a new register of income, wealth, and consumption data that suggests simply moving the Survey of Consumer Finances to a 1-year cadence.28 This would provide insight into the entire distribution of wealth annually, on a moderate time lag. SCF estimates are released every three years in September and provide data on the previous year. The 2026 Survey of Consumer Finances, due out in a few months, for example, will provide updated distributional data for 2025. A 1-year cadence would reduce discrepancies in tax modeling that arise from taking a past vintage of the Survey of Consumer Finances and extrapolating its estimates forward into the current year or future years.
Income in the United States
Measuring income and defining top income groups
Though many data sources attempt to measure U.S. individual or household income, detailed information on the top 0.1 percent is hard to find. Two main methods exist: using survey data and using tax data.
Using survey data to measure income
Government surveys such as the Current Population Survey and the American Community Survey are often used by researchers to estimate “money income” across the U.S. income distribution. Money income is income received regularly and includes wages, cash transfers from the government (such as unemployment compensation and Social Security), retirement income, interest and dividends on assets, and other cash income. It does not include realized capital gains, or the profits a household receives from selling financial assets.
These surveys are the primary source of data on where a given amount of income falls in the distribution of all U.S. income. By downloading the 2025 CPS Annual Social and Economic Supplements survey data,29 one can quickly assess what percentile of the distribution a total income of $80,000 represents in 2025: the 46th percentile for a household and 64th percentile for an individual. Yet it is not possible to accurately ascertain a level of income for a top 1 percent household in this manner, much less a top 0.1 percent household, because the Current Population Survey does not sample enough high-income households, and, for those it does sample, it applies privacy protections that downwardly bias incomes in the top 5 percent.
Using tax data to measure income
To get visibility into higher sections of the income distribution, administrative tax data must be employed. This comes in various forms.
- The Joint Committee on Taxation in the U.S. Congress and the nonpartisan Congressional Budget Office have access to the individual and sole proprietor file, or INSOLE, produced by the IRS’s Statistics of Income Division. This is a large random sample of all tax returns with no privacy protections applied.
- Researchers outside of government often use the Public Use File, or PUF, which is a sample from INSOLE with privacy protections applied.
- Researchers also make use of tabular data released annually by the IRS’s Statistics of Income Division. The tabular provides aggregate data on selected statistics, such as the total number of returns filed, total Adjusted Gross Income, income thresholds, and taxes paid broken out by percentiles of the income distribution.
All of these sources of income data are considerably delayed. As of this writing, the most recent PUF is from 2015. The IRS is attempting to create a synthetic PUF with strong privacy protections that could be produced on a timelier basis, but this project is moving slowly.30 Even INSOLE, which is available only to a small number of government researchers, is significantly delayed. The current version is from 2023, a lag of 3 years.
Tabular data from the IRS’s Statistics of Income Division are released more regularly and with less time lag than the Public Use File but provide far less distributional data and are released on approximately a 3-year lag. Nonetheless, these tables are the timeliest data available on officially reported income at the very high end of the U.S. distribution. Thomas Piketty of the Paris School of Economics and UC Berkeley’s Saez’s analysis of tax returns between 1913 and 199831 is a landmark study that uses the IRS’s SOI tabular data to track top incomes. Piketty and Saez use U.S. Census Bureau population estimates to add nonfiling tax units to the data. This lowers income cut-offs at the top because including nonfilers increases the number of tax units and enlarges the size of any given percentile group, resulting in the top 0.1 percent cut-off, for example, falling lower in the income distribution.
Incomes in the Piketty and Saez data are based on the Adjusted Gross Income found on tax forms. Adjusted Gross Income includes salaries, tips, self-employment income, retirement distributions, pass-through and other business income, realized capital gains, dividends and interest, some government transfers such as Unemployment Insurance and taxable Social Security benefits, and other small items including gambling winnings. It is subject to some above-the-line adjustments, such as student loan interest and health insurance for the self-employed. Piketty and Saez produce data series that include and exclude realized capital gains. They call their income concept fiscal income to denote that their income concept includes only income observed on tax forms.
Realized capital gains are gains from assets that were sold. These appear on tax forms as they are usually subject to federal taxation. Unrealized capital gains are gains in the value of an asset that is not sold. If a stock is worth $10, and it increases in value to $20, shareholders then have $10 of unrealized capital gains. These are not observed in taxes since they are not subject to tax until sold and as such are quite difficult to attribute to households, although there have been some recent attempts.32
There are conflicting views among researchers of whether income should be measured with realized capital gains, unrealized capital gains, or no capital gains at all. The Canberra Group, a UN convened expert group that developed a handbook on measuring income, prefers regular and recurring income and recommends that capital gains be excluded from income altogether because capital gains are volatile and depend on individuals’ decisions to sell assets.33 In part, this recommendation is to facilitate international comparisons, which can be difficult for capital gains earned under different tax regimes. Meanwhile, so-called Haig-Simons income—an income concept that defines income as consumption plus the change in net wealth over a given period34—requires the inclusion of unrealized capital gains.
As a practical matter, realized capital gains are the easiest to track and accordingly are what is often seen in U.S. data. Realized capital gains are highly volatile from year to year and have an especially large impact on the incomes of the top 0.1 percent. Figure 1 below highlights the impact capital gains can make. It charts the income thresholds that placed a tax unit in the top 1 percent and top 0.1 percent for each year between 1999 and 2022, both with and without realized capital gains. The volatility of capital gains is most pronounced for the top 0.1 percent, while top 1 percent thresholds move much less dramatically. (See Figure 1.)
Figure 1
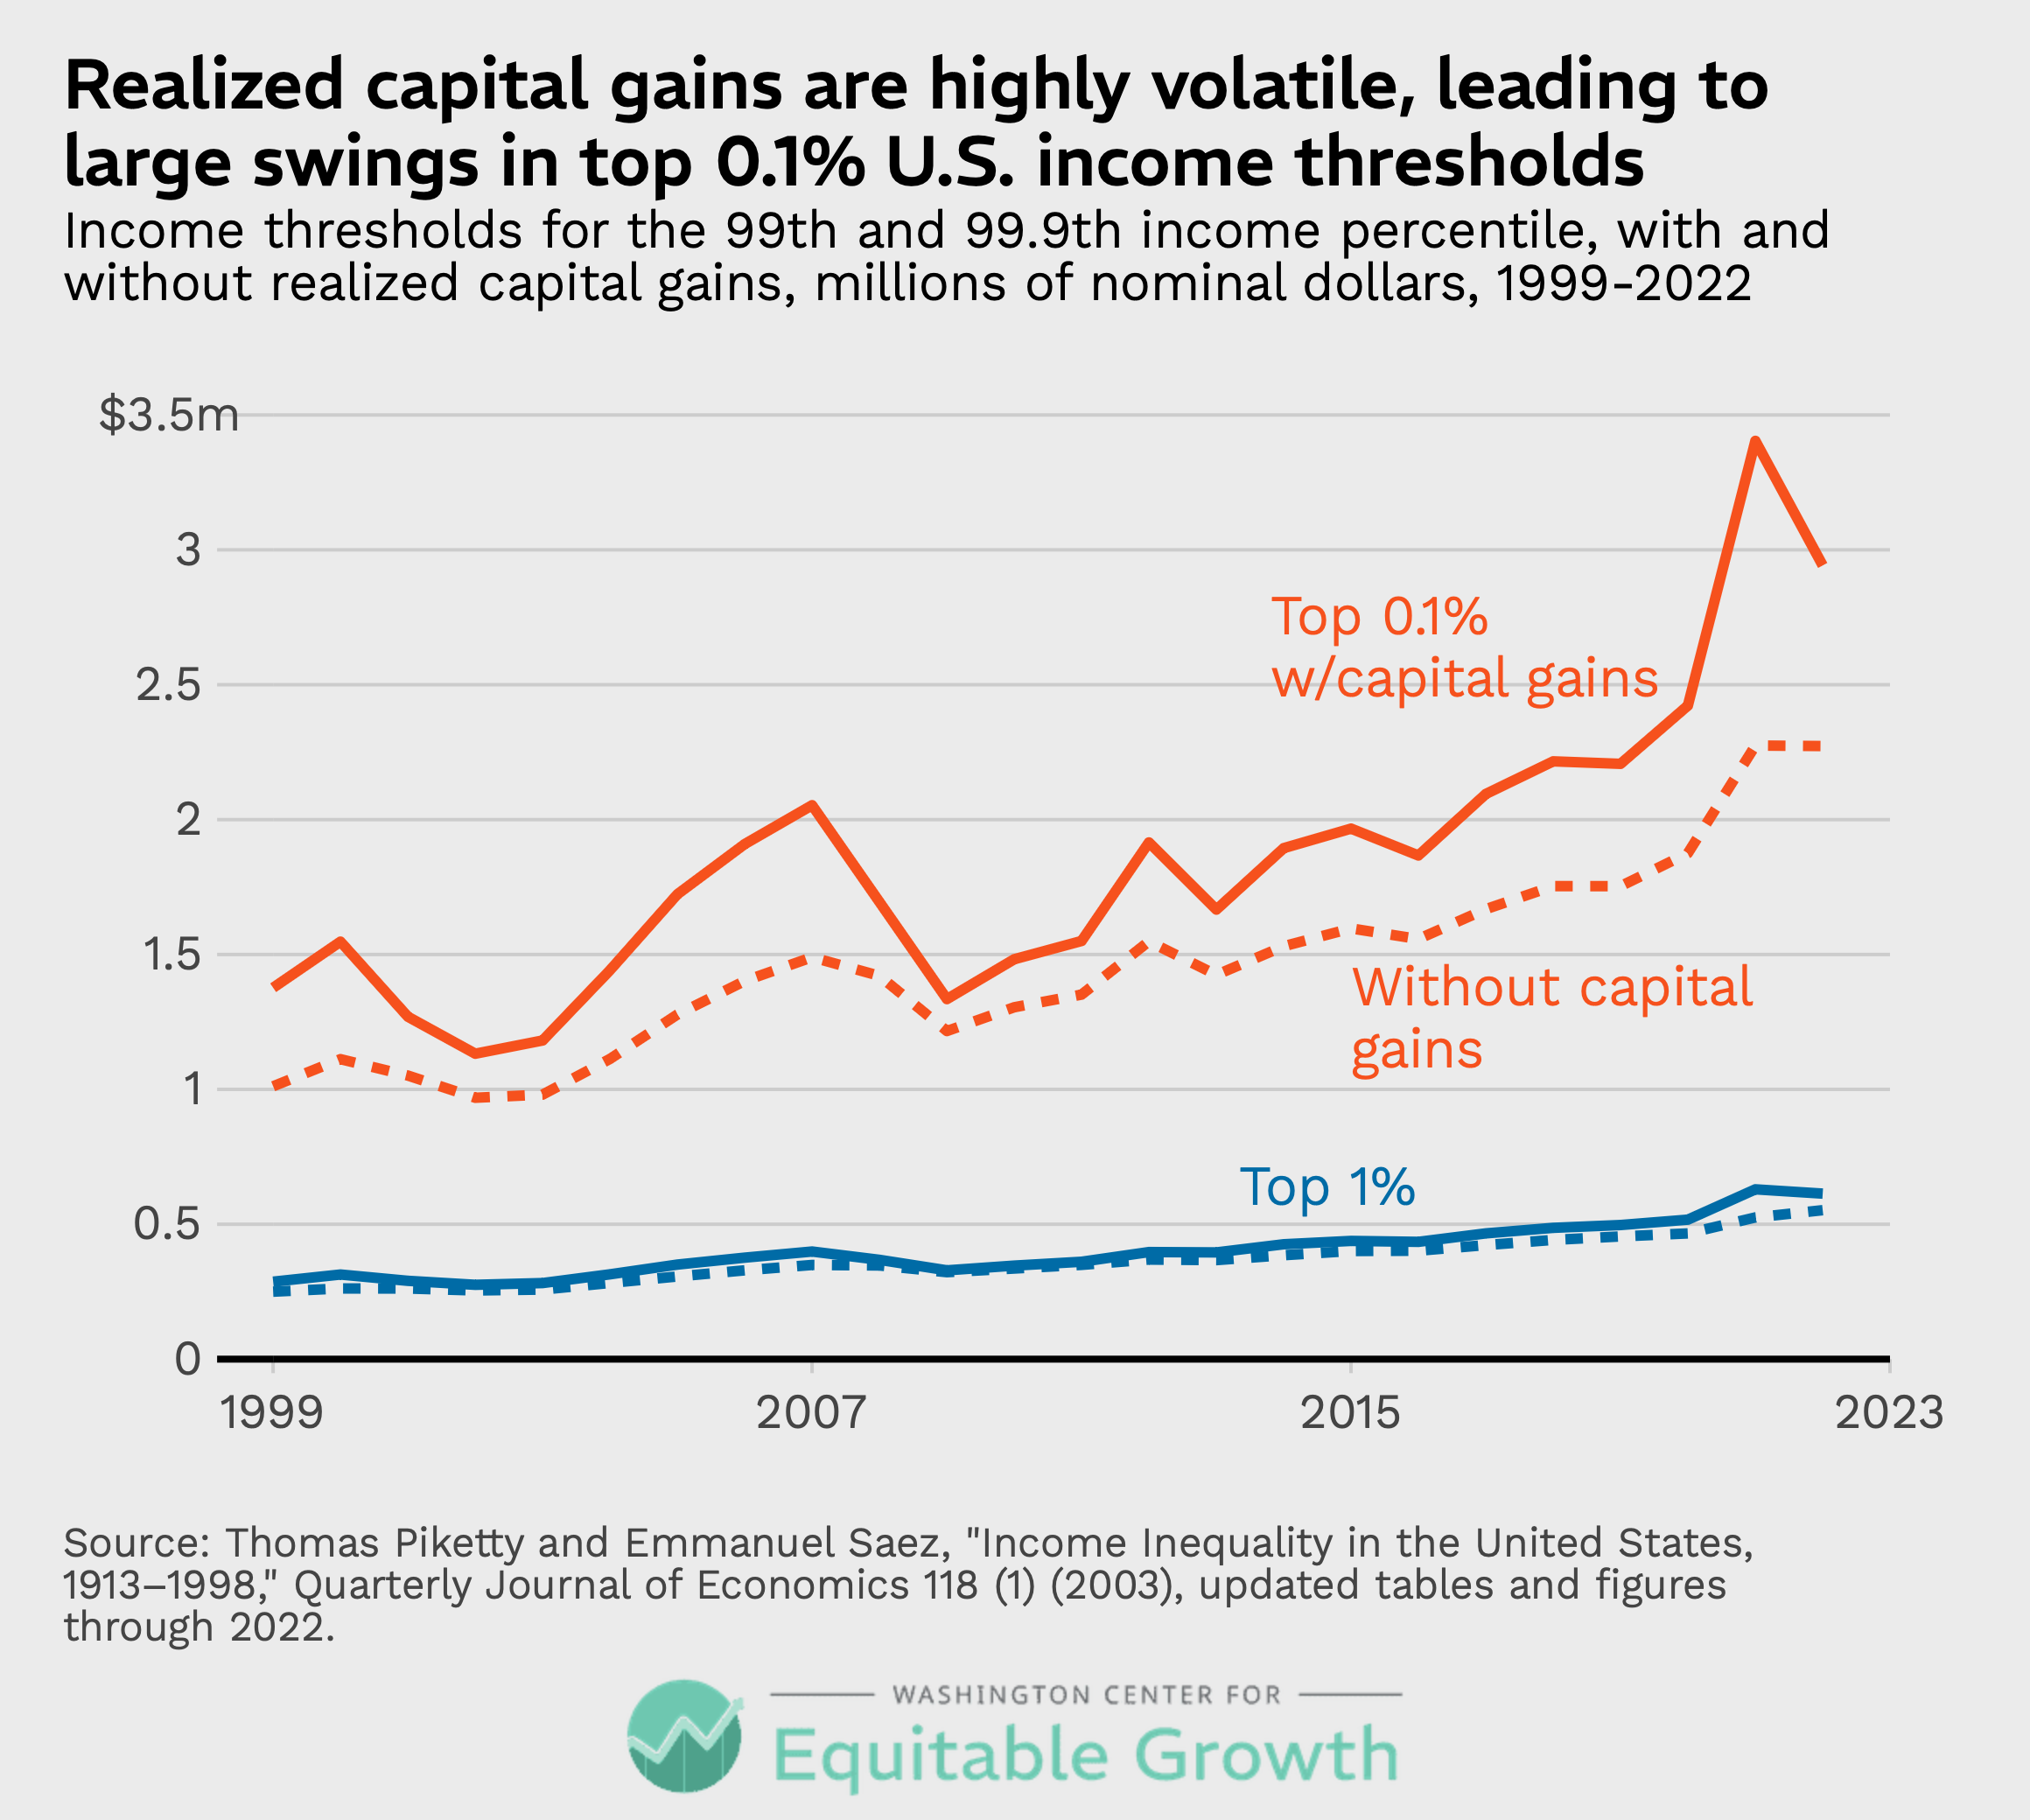
As Figure 1 shows, the threshold for the top 0.1 percent with capital gains in 2007, right before the onset of the Great Recession of 2007–2009, was just more than $2 million. That level was not exceeded again until 2017. If policymakers decided to use the 2007 threshold in a tax proposal, then the tax would impact a far smaller number of tax units because the threshold was determined in a year where realized capital gains were unusually high.
Meanwhile, in 2007, the top 1 percent threshold rose to $400,000. After dipping in the wake of the Great Recession, it next rose above this level in 2012, marking a much quicker recovery than that of top 0.1 percent tax units.
According to the updated fiscal incomeseries from Piketty and Saez,36 it took an income of $2.3 million, excluding capital gains, to be considered within the top 0.1 percent in 2022. If realized capital gains were included, the top 0.1 percent threshold was $2.9 million. Table 2 below presents the 2022 cutoffs for very high-income households, as recorded in the IRS’s SOI data and in Piketty and Saez’s modified data that includes nonfiling tax units in the distribution. All figures are in nominal dollars for 2022. (See Table 2.)
Table 2
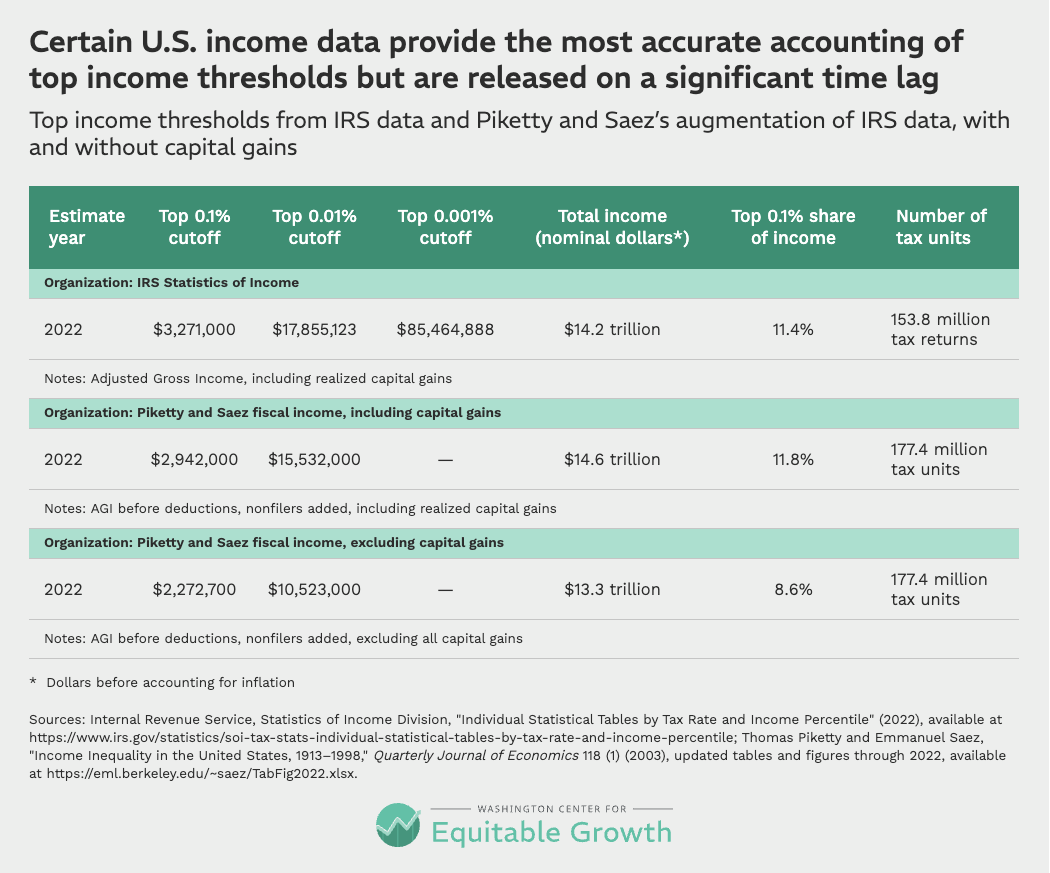
These SOI statistics from the IRS offer the most up-to-date insight into high-end incomes based on actual data collection from the year the data were collected. Anyone publishing more recent cut-off points for high incomes is basing their estimates on some form of imputation or extrapolation.
Using income data to model tax policy
Extrapolating current year and future year income is an essential part of tax modeling. Tax modeling organizations, such as the Tax Policy Foundation, Yale Budget Lab, the Tax Policy Center, and others, typically start with the most recently available PUF and “age” incomes forward in time using recent data on income aggregates as a guide.
The Tax Policy Center, for example, uses a two-step process to age a PUF file forward.38 First, they use tabular SOI data and Congressional Budget Office forecasts to inflate incomes for each tax unit by the amount of income growth individuals in a particular income range experienced in particular income components, such as wages, by year. The PUF is a sample of all tax units that comes with weights indicating how many tax units a given observation represents. In the second step, the Tax Policy Center adjusts these weights so that the total amount of income and the distribution of income match published aggregates. Other tax modelers use very similar methods to age income forward.39
There is relatively little data on how accurate this process is. It is well-known that the microsimulation of a population becomes less accurate during times of significant economic volatility, such as during the COVID-19 pandemic and recession in 2020. Major changes to the tax system, including 2017’s Tax Cuts and Jobs Act, also can introduce uncertainty.
It is important to keep in mind that the income distribution, and specific cut-off points in the income distribution, are not the primary output of tax modeling. Rather, tax modeling organizations care most about percent changes in income due to policy changes across the distribution. Accurate point estimates of income at certain percentiles in the distribution may not be a primary goal of model optimization.
Income reported on tax forms, with some modifications, is the bread and butter of tax modelers. Modelers start with Adjusted Gross Income and add in streams of income that are not observed on tax forms but are regular sources of income for households, such as nontaxable Social Security income, an employer’s share of payroll taxes, fringe benefits from employers (including health insurance), and corporate tax liability. All the tax modelers include realized capital gains, which are a component of Adjusted Gross Income.
It is common for researchers to construct both pre- and post-tax metrics of income. The employer’s share of Social Security and Medicare taxes, commonly called payroll taxes, are added to a worker’s pre-tax income because these are essentially wages that the employer is paying on behalf of the employee. Although corporate taxes are not directly paid by employees, it is commonly assumed that wages would be higher in the absence of corporate taxes, so some of the incidence of this tax40 is on labor. A common assumption is that 25 percent of corporate taxes should be added to pre-tax labor incomes.
Income is also frequently equivalized when reporting how tax policies will impact tax units or households. An equivalence scale adjusts household income41 according to the number of people in the household to account for economies of scale. Intuitively, these scales assume that if two people live together and have a combined income of $100,000, those people are better off than a single person with an income of $50,000 even though these households have the same per capita income. That is because the two-person household can expect to pay less for rent and other necessities.
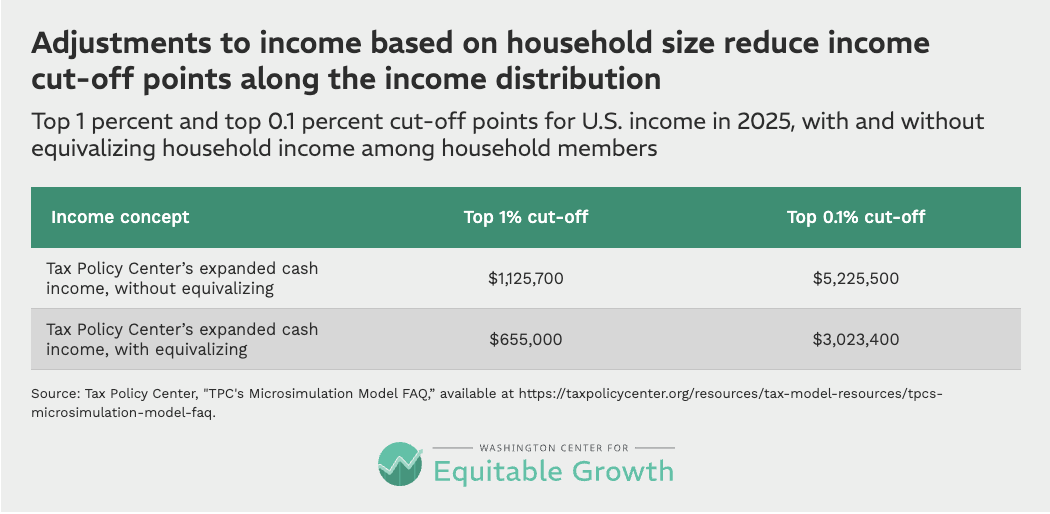
A common equivalence scale adjustment is to divide household income by the square root of the number of people in the household. Equivalizing reduces income all along the distribution, making cut-offs for each percentile of income lower. As an example, Table 3 shows the top 1 percent and top 0.1 percent cut-off points for income in 2025, according to the Tax Policy Center, both with and without equivalizing. (See Table 3.)
Table 3
Equivalizing, and adding in things such as corporate taxes to people’s incomes, makes the income thresholds reported by tax modelers difficult to parse. The reported cut-off points for each of these organizations is summarized in Table 4 below. All reported estimates are for pre-tax income. (See Table 4.)
Table 4
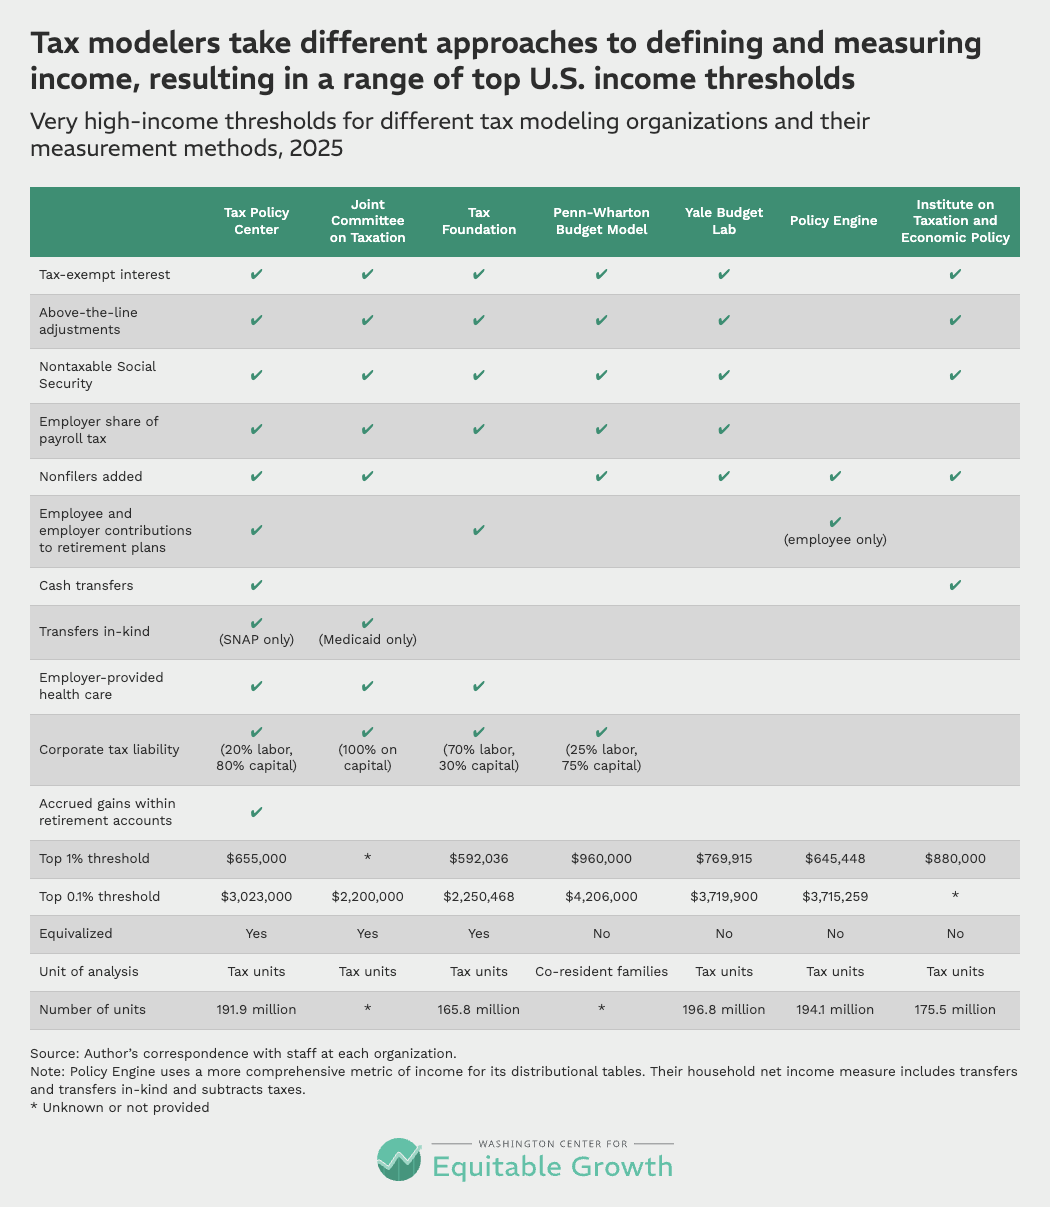
There are many reasons these estimates vary, and no simple way to identify precisely what drives the differences. Equivalizing and adding in nonfilers both lower the top income thresholds. Using families as the unit of analysis increases income thresholds.
Broader definitions of income by tax modelers also increase top income thresholds. Generally, these estimates start with Adjusted Gross Income and add in above-the-line adjustments, which restores some tax deductions that reduce Adjusted Gross Income, such as the student loan interest deduction. Most models then add fringe benefits, including employer-provided health insurance and retirement plan contributions. Nontaxable Social Security benefits and the employer’s share of payroll taxes are also common additions.
Income additions that are not common to all models include corporate tax liability, which increases incomes across the distribution. The Tax Policy Center is notable for including accruals in defined-benefit pension accounts, something no other modeler includes. This leads to higher income thresholds than those of other modelers who equivalize income. Transfers-in-kind, such as the Supplemental Nutrition Assistance Program or Medicaid, are also occasionally added.
Some of these income additions make little difference for top income thresholds. SNAP benefits, for example, do not impact top income thresholds because the benefits are relatively small per person and only accrue to low-income families. Employer-provided health insurance and pension account accruals, on the other hand, could have a significant impact because these amounts can be larger per family and are commonly earned by high-income households.
In addition to these differences, estimates might vary because the modelers age their data differently, start with a different PUF vintage, or do not use the PUF at all (Policy Engine notably uses the Current Population Survey’s Annual Social and Economic Supplements). It is comforting that the estimates in Table 4 are somewhat close to each other, but the disparities between them emphasize that the microsimulation methods used by tax modelers reflect a slew of methodological choices that are selected with the end goal of accurately simulating taxes rather than creating an accurate distribution of income.
Tracking income mobility
It is commonly noted that there is a significant amount of churn within top income groups in the United States. Recent research from the Joint Committee on Taxation’s David Splinter and Jeff Larrimore at the Federal Reserve finds that 49 percent of the top 0.1 percent in 2021 had exited that group 1 year later,42 in 2022, and that 70 percent of the top 0.1 percent in 2012 had exited that group 10 years later, by 2022.
Those households did not necessarily fall far. Between 2005 and 2015, the authors find that 70 percent of the top 0.1 percent of U.S. households remained in the top 5 percent of the income distribution.
Distributional National Accounts: Toward more comprehensive income measurement
Tax modeling organizations are focused on income concepts that allow them to rank tax units and report on changes in income as a result of tax policies. This focus results in some decisions that might not be ideal for simply measuring income. The Tax Policy Center, for example, includes accrued gains in 401(k) accounts in its definition of income, but it does not include accrued capital gains generally. Its rationale for this is about avoiding distortions in the tax code (see the discussion on page 8 in this 2013 report43). But from a measurement perspective, it does not seem consistent.
A separate strain of academic literature is attempting to get away from ad hoc income concepts by targeting a comprehensive income concept from the National Income and Product Accounts. In 2019, Paris School of Economics’ Piketty and UC Berkeley’s Saez and Zucman released new estimates that attempt to account for the entirety of National Income44—a National Income and Product Accounts45 concept, similar to Gross Domestic Product. National Income,46 the reasoning goes, is a comprehensive accounting of the income of a nation, so in distributing it to individuals, every possible stream of income is accounted for. This definition of income is more expansive than the definition used by any of the tax modelers discussed above.
The difficulty with this approach is that distributing National Income requires making dozens of assumptions about how streams of income observed in the economy should be allocated to individuals. National Income, for instance, includes income hidden from the IRS to evade taxes. There is no way to know for sure which individuals earned this unobserved income, so assumptions must be made by the research team.
Some other parts of National Income are arguably even more confounding. Discretionary government spending must be allocated to individuals, which means finding ways to distribute, for example, military spending. This is a difficult exercise. A common argument is that defense spending accrues to all U.S. individuals equally, but if defense spending is considered insurance against the loss of income or wealth, then higher-income individuals have more to insure. In some extraordinary cases, the application of the U.S. military might even deliver targeted benefits to specific U.S. households.47
There are, however, benefits to the National Accounts approach. National Income includes retained corporate earnings, and distributing these retained earnings to households is conceptually a way to distribute unrealized capital gains—something that is unobserved in virtually all other income measurement methods. Unrealized gains are difficult to track, and Piketty, Saez, and Zucman’s solution is far from perfect. They do not directly observe share ownership, so they impute it to individuals based on other observed sources of capital income. Some recent research using Norwegian administrative data that does allow for share ownership to be traced has indicated that this may not be the most accurate way to allocate these unrealized gains.48
The U.S. Bureau of Economic Analysis has started to distribute Personal Income, another concept from the National Income and Product Accounts, and this data series is a promising new avenue for understanding inequality in the United States. Personal Income excludes retained corporate earnings and some other income concepts that do not accrue directly to households, such as discretionary government spending.
It can be difficult to parse income thresholds from the Piketty, Saez, and Zucman data because of the exotic streams of income they add, but Table 5 below shows the thresholds for high incomes for 2024, their most recent year of data. The unit of analysis is the equal-split adult, as discussed in the wealth section above. Compared to the tax modelers, who use tax units as their unit of analysis, this choice lowers income thresholds. (See Table 5.)
Table 5
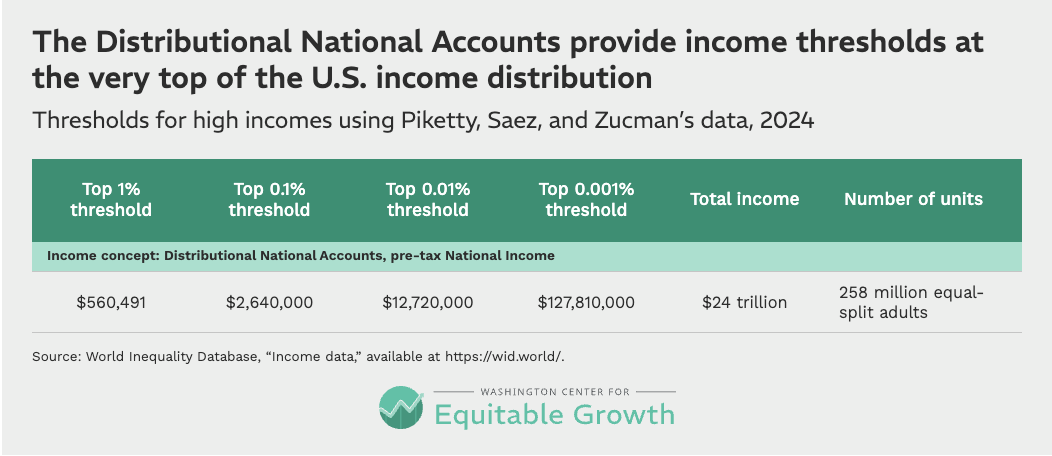
These thresholds are available on a timelier basis than the IRS data. The WID.world49 website shows income thresholds all along the U.S. income distribution. This level of detail and the regular publication of these statistics make them a very useful reference.
Using income data for policy analysis
For the purposes of understanding which U.S. families at the high end of the income distribution are being targeted by a policy, the simplest approach is to use Piketty and Saez’s fiscal income series.50 It makes necessary modifications to the raw tax data that provide a better sense of where the top 1 percent and top 0.1 percent cut-offs are. Both the SOI data from the IRS and Piketty and Saez’s data also provide some insight into even further reaches of the income distribution—all the way into the top 0.01 percent.
Unfortunately, the IRS data, and Piketty and Saez’s derived series, are significantly delayed, with 2022 being the most current year as of this writing. The cut-offs given in models used by tax modeling organizations are more current but are also more difficult to interpret because they are often equivalized and include exotic forms of income, such as corporate tax liability. Moreover, current or future year cut-offs provided by these organizations have been aged forward from older data, introducing uncertainty.
For more up-to-date estimates, Piketty, Saez, and Zucman’s national income series is useful.51
The future of income measurement in the United States
Estimates of income thresholds produced by tax modeling organizations are not very well-suited to understanding where a given income falls in the income distribution. They use a variety of ad hoc definitions of income, their estimates are really forecasts based on aging old data, and tax units are not an ideal unit of analysis.
Ideally, a government agency would take up the task of producing timely and accurate estimates of household income all along the income distribution. Conveniently, the blueprint for creating a national system of statistics for tracking income has already been written. A National Academy of Sciences report released in 2024 convened experts on economic measurement to come up with ways to produce more accurate and more timely estimates of income all along the distribution.52 By using existing data sources in more innovative ways, the federal statistical agencies could create a detailed portrait of income in the United States with relatively little lag time.
The barrier to realizing this report’s recommendations is a lack of resources. Statistical agencies routinely see their level of funding decline in real terms after accounting for inflation, and the result is that they are rarely able to take on ambitious new products. The IRS, for example, has not released an updated PUF in several years. They are working on a synthetic PUF that could be produced on a short time lag, but that work has been delayed because its Statistics of Income Division is starved of resources.
Of course, in addition to improving data, more IRS funding also would help the agency combat tax evasion. There are estimates of how much income is hidden from tax authorities,53 but some research suggests these estimates are too low,54 and it is unclear exactly who earns this income. If IRS enforcement was better resourced, more of this income could be found and there would be a better sense of what kinds of households earn it, allowing for more accurate measurement of top incomes in the United States.
Conclusion
Precisely estimating the distribution of U.S. wealth or income at a point in time is a difficult exercise. Survey data often have poor coverage of the small number of households at the very top of the distribution and administrative data are often dated and may omit important streams of income. Tax modelers use different definitions of income and sometimes different units of analysis to report their results. Consequently, estimates describing the distribution of income and wealth can vary—sometimes significantly.
For policymakers, it is important to understand why these differences arise. This report provides some guidelines for understanding how many people fall above a given income or wealth threshold, but these should be treated as approximate estimates. Thresholds will change from year to year due to the business cycle, inflation, or even changing patterns of household formation.
As a result, picking income or wealth thresholds is an imprecise art. Revenue scoring by tax modelers creates further ambiguities, because the same thresholds might receive different revenue estimates due to assumptions about how people will respond to a new tax. That said, understanding these subtle discrepancies allows policymakers to make informed policy design decisions on how to target the small slices of the U.S. population who hold the most income and wealth.
About the author
Austin Clemens is a visiting fellow at the Washington Center for Equitable Growth. He is an expert on economic inequality in the United States and the federal economic statistics system.
Acknowledgements
The author thanks Max Ghenis, Jake Mortenson, Steve Wamhoff, Kent Smetters, John Ricco, and Garrett Watson for providing the data to fill Table 4. The author also thanks David Mitchell, Alan Davis, and Larry Ottinger for their helpful comments.
Equitable Growth also acknowledges our co-publisher, the Extreme Wealth Center, for its financial and intellectual support in producing this report.
End Notes
1. Niko Gallogy, “California Billionaire Tax,” The New York Times, DealBook, March 14, 2026, available at https://www.nytimes.com/2026/03/14/business/dealbook/california-billionaire-tax.html.
2. The Budget Lab at Yale, “Senator Van Hollen’s Working Americans’ Tax Cut Act” (2026), available at https://budgetlab.yale.edu/research/senator-van-hollens-working-americans-tax-cut-act.
3. U.S. Senate, “Make Billionaires Pay Their Fair Share Act: Bill Summary” (2026), available at https://www.sanders.senate.gov/wp-content/uploads/Wealth-Tax-Bill-Summary.pdf.
4. “Tax the Greedy Billionaires: About us,” available at https://taxgreed.org/about/ (last accessed April 2026).
5. Board of Governors of the Federal Reserve System, “Survey of Consumer Finances” (2023), available at https://www.federalreserve.gov/econres/scfindex.htm.
6. Jesse Bricker and others, “Wealth concentration in the U.S. after augmenting the upper tail of the survey of consumer finances,” Economics Letters 184 (2019), available at https://www.sciencedirect.com/science/article/abs/pii/S0165176519303295.
7. Board of Governors of the Federal Reserve System, “DFA: Distributional Financial Accounts” (2026), available at https://www.federalreserve.gov/releases/z1/dataviz/dfa/index.html.
8. Board of Governors of the Federal Reserve System, “Financial Accounts of the United States” (2026), available at https://www.federalreserve.gov/releases/z1/.
9. Wojciech Kopczuk and Emmanuel Saez, “Top Wealth Shares in the United States, 1916–2000: Evidence From Estate Tax Returns,” National Tax Journal 57 (2) (2004), available at https://www.journals.uchicago.edu/doi/10.17310/ntj.2004.2S.05.
10. Emmanuel Saez and Gabriel Zucman, “Wealth Inequality in the United States since 1913: Evidence from Capitalized Income Tax Data,” Quarterly Journal of Economics 131 (2) (2016), available at https://gabriel-zucman.eu/files/SaezZucman2016QJE.pdf.
11. Matthew Smith, Owen Zidar, and Eric Zwick, “Top Wealth in America: New Estimates Under Heterogeneous Returns,” Quarterly Journal of Economics 138 (1) (2023), available at https://academic.oup.com/qje/article-abstract/138/1/515/6678447?redirectedFrom=fulltext.
12. Moritz Kuhn and José-Víctor Ríos-Rull, “Income and Wealth Inequality in the United States: An Update Including the 2022 Wave.” Working Paper (2025), available at https://www.sas.upenn.edu/~vr0j/papers/vrUpdate-22.pdf.
13. Congressional Budget Office, “Trends in the Distribution of Household Wealth, 1989 to 2019” (2022), available at https://www.cbo.gov/publication/60807.
14. Michael Batty and others, “The Distributional Financial Accounts of the United States” (2022), available at https://www.nber.org/books-and-chapters/measuring-distribution-and-mobility-income-and-wealth/distributional-financial-accounts-united-states.
15. Emmanuel Saez and Gabriel Zucman, “Progressive Wealth Taxation: Revenue Estimates for Senator Warren’s Ultra-Millionaire Tax” (2019), available at https://gabriel-zucman.eu/files/saez-zucman-wealthtax-warren.pdf.
16. Emmanuel Saez and Gabriel Zucman, “Revenue and Distributional Analysis of Senator Warren’s Ultra-Millionaire Tax Act” (2026), available at https://www.warren.senate.gov/imo/media/doc/ultra-millionaire_tax_act_score.pdf.
17. Ultra-Millionaire Tax Act of 2026, S. 4246, 119th Cong. 2d sess. (2026), available at https://www.congress.gov/bill/119th-congress/senate-bill/4246.
18. Make Billionaires Pay Their Fair Share Act, S. 3956, 119th Cong. 2d sess. (2026), available at https://www.congress.gov/bill/119th-congress/senate-bill/3956.
19. Americans for Tax Fairness, “U.S. Billionaire Wealth Data” (2025), available at https://docs.google.com/spreadsheets/d/15uAjHwa4dHGZeuNe7iPddBvzMlpgdSPqWmqOmHD2tQA/edit?gid=814281239.
20. Inti Pacheco and others, “What We Know About America’s Billionaires,” The Wall Street Journal, September 2, 2025, available at https://www.wsj.com/finance/investing/what-we-know-about-americas-billionaires-1-135-and-counting-98d22268.
21. Stephan Whitaker and Ross Cohen-Kristiansen, “An Update on Wealth Mobility,” Federal Reserve Bank of Cleveland Economic Commentary, December 19, 2022, available at https://www.clevelandfed.org/publications/economic-commentary/2022/ec-202217-an-update-on-wealth-mobility.
22. Ariel Gelrud Shiro and others, “Stuck on the Ladder: Intragenerational Wealth Mobility in the United States” (Washington: The Brookings Institution, 2022), available at https://www.brookings.edu/wp-content/uploads/2022/06/2022_FMCI_IntragenerationalWealthMobility_FINAL.pdf.
23. World Inequality Database, available at https://wid.world/ (last accessed April 2026).
24. Board of Governors of the Federal Reserve System, “DFA: Distributional Financial Accounts.”
25. Washington Center for Equitable Growth, “U.S. Inequality Tracker,” available at https://inequalitytracker.equitablegrowth.org/ (last accessed April 2026).
26. Jon Epland and Mads Ivar Kirkeberg, “Wealth Distribution in Norway: Evidence from a New Register-Based Data Source,” paper presented at the 32nd General Conference of the International Association for Research in Income and Wealth, Boston, MA, August 5–11, 2012, available at http://old.iariw.org/papers/2012/EplandPaper.pdf.
27. Annette Alstadsaeter and others, “Accounting for Business Income in Measuring Top Income Shares: Integrated Accrual Approach Using Individual and Firm Data from Norway,” Journal of the European Economic Association (2025), available at https://academic.oup.com/jeea/advance-article/doi/10.1093/jeea/jvaf058/8378100.
28. National Academies of Sciences, Engineering, and Medicine, “An Integrated System of U.S. Household Income, Wealth, and Consumption Data and Statistics to Inform Policy and Research,” available at https://www.nationalacademies.org/projects/DBASSE-CNSTAT-21-01/resources (last accessed April 2026).
29. U.S. Census Bureau, “Using CPS ASEC Public Use Microdata,” last revised October 8, 2021, available at https://www.census.gov/topics/population/foreign-born/guidance/cps-guidance/using-cps-asec-microdata.html.
30. Tax Notes, “IRS Releases Documents: Analysis of Tax Data,” April 16, 2024, available at https://www.taxnotes.com/research/federal/other-documents/other-irs-documents/irs-releases-documents-analysis-tax-data/7jg44.
31. Thomas Piketty and Emmanuel Saez, “Income Inequality in the United States, 1913–1998,” Quarterly Journal of Economics 118 (1) (2003), available at https://eml.berkeley.edu/~saez/pikettyqje.pdf.
32. Cole Campbell, Jacob A. Robbins, and Sam Wylde, “The Distribution of Capital Gains in the United States.” Working Paper (2024), available at https://jacobarobbins.com/25rpdistcapgain.pdf.
33. United Nations Economic Commission for Europe, Canberra Group Handbook on Household Income Statistics, 2nd ed. (Geneva: United Nations, 2011), available at https://unece.org/fileadmin/DAM/stats/groups/cgh/Canbera_Handbook_2011_WEB.pdf.
34. “Haig-Simons Income,” available at https://en.wikipedia.org/wiki/Haig–Simons_income (last accessed April 2026).
35. Emily Y. Lin and Navodhya Samarakoon, “Who Are Married-Filing-Separately Filers and Why Should We Care?” (Washington: U.S. Department of the Treasury, Office of Tax Analysis, 2023), available at https://taxpolicycenter.org/sites/default/files/irs_tpc_2023_session_3.pdf.
36. Piketty and Saez, “Income Inequality in the United States, 1913–1998,” updated tables and figures through 2022, available at https://eml.berkeley.edu/~saez/TabFig2022.xlsx.
37. Paul Kiel and others, “America’s Highest Incomes and Taxes Revealed,” ProPublica, April 13, 2022, available at https://projects.propublica.org/americas-highest-incomes-and-taxes-revealed/.
38. Tax Policy Center, “Microsimulation Model FAQ” (n.d.), available at https://taxpolicycenter.org/resources/tax-model-resources/tpcs-microsimulation-model-faq.
39. The Budget Lab at Yale, “Tax Microsimulation at the Budget Lab” (2024), available at https://budgetlab.yale.edu/research/tax-microsimulation-budget-lab.
40. Institute on Taxation and Economic Policy, “Why Does Tax Incidence Matter and How Do We Measure It?” (n.d.), available at https://itep.org/why-does-tax-incidence-matter-and-how-do-we-measure-it/.
41. U.S. Census Bureau, “Equivalence Adjustment or Income” (2021), available at https://www.census.gov/topics/income-poverty/income-inequality/about/metrics/equivalence.html.
42. David Splinter and Jeff Larrimore, “Top Income Mobility in the United States.” Working Paper (2024), available at https://www.davidsplinter.com/TopMobility.pdf.
43. Joseph Rosenberg, “Measuring Income for Distributional Analysis” (Washington: Tax Policy Center, 2013), available at https://taxpolicycenter.org/sites/default/files/alfresco/publication-pdfs/412871-Measuring-Income-for-Distributional-Analysis.PDF.
44. Thomas Piketty, Emmanuel Saez, and Gabriel Zucman, “Distributional National Accounts: Methods and Estimates for the United States,” Quarterly Journal of Economics 133 (2) (2018), available at https://gabriel-zucman.eu/files/PSZ2018QJE.pdf.
45. “National Income and Product Accounts,” available at https://en.wikipedia.org/wiki/National_Income_and_Product_Accounts (last accessed April 2026).
46. U.S. Bureau of Economic Analysis, “National Income and Product Accounts,” interactive tables (n.d.), available at https://apps.bea.gov/iTable/?reqid=19&step=2&isuri=1&categories=survey.
47. Michael Martin, “How Billionaire and Trump Donor Paul Singer Could Benefit from Maduro’s Removal,” NPR, January 7, 2026, available at https://www.npr.org/2026/01/07/nx-s1-5668254/how-billionaire-and-trump-donor-paul-singer-could-benefit-from-maduros-removal.
48. Alstadsæter and others, “Accounting for Business Income in Measuring Top Income Shares: Integrated Accrual Approach Using Individual and Firm Data from Norway.”
49. World Inequality Database, “Income data,” available at https://wid.world/ (last accessed April 2026).
50. Piketty and Saez, “Income Inequality in the United States, 1913–1998,” updated tables and figures through 2022.
51. World Inequality Database, “Income data.”
52. National Academies of Sciences, Engineering, and Medicine, “An Integrated System of U.S. Household Income, Wealth, and Consumption Data and Statistics to Inform Policy and Research.”
53. U.S. Bureau of Economic Analysis, “Table 7.14. Relation of Nonfarm Proprietors’ Income in the National Income and Product Accounts to Corresponding Measures as Published by the Internal Revenue Service” (n.d.), available at https://apps.bea.gov/iTable/?reqid=19&step=2&isuri=1&categories=survey&_gl=1*1a38r1l*_ga*MjIxNDQ1NDg4LjE0ODE1NTI4NTY.*_ga_J4698JNNFT*czE3Nzg3NjY1NDQkbzEkZzEkdDE3Nzg3NjY1NTQkajUwJGwwJGgw.
54. John Guyton and others, “Tax Evasion at the Top of the Income Distribution: Theory and Evidence.” Working Paper 28542 (National Bureau of Economic Research, 2021), available at https://www.nber.org/system/files/working_papers/w28542/w28542.pdf.
Related




Explore the Equitable Growth network of experts around the country and get answers to today's most pressing questions!