Equitable Growth’s Jobs Day Graphs: July 2021 Report Edition
On August 6, the U.S. Bureau of Labor Statistics released new data on the U.S. labor market during the month of July. Below are five graphs compiled by Equitable Growth staff highlighting important trends in the data.
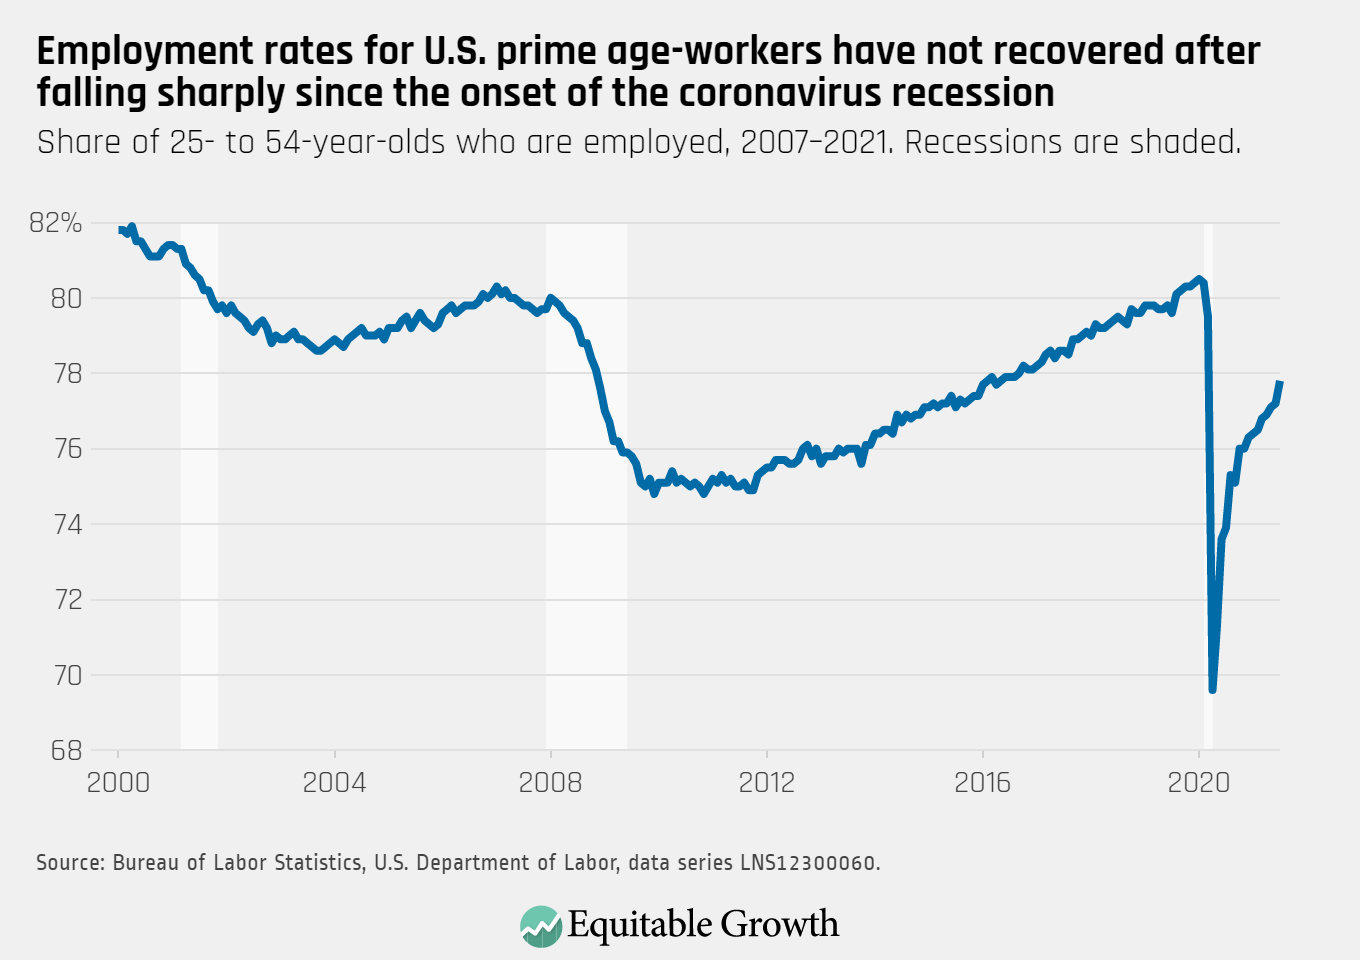
Prime-age employment rates increased to 77.8 percent in July from 77.2 percent in June, reflecting significant employment growth over the month.
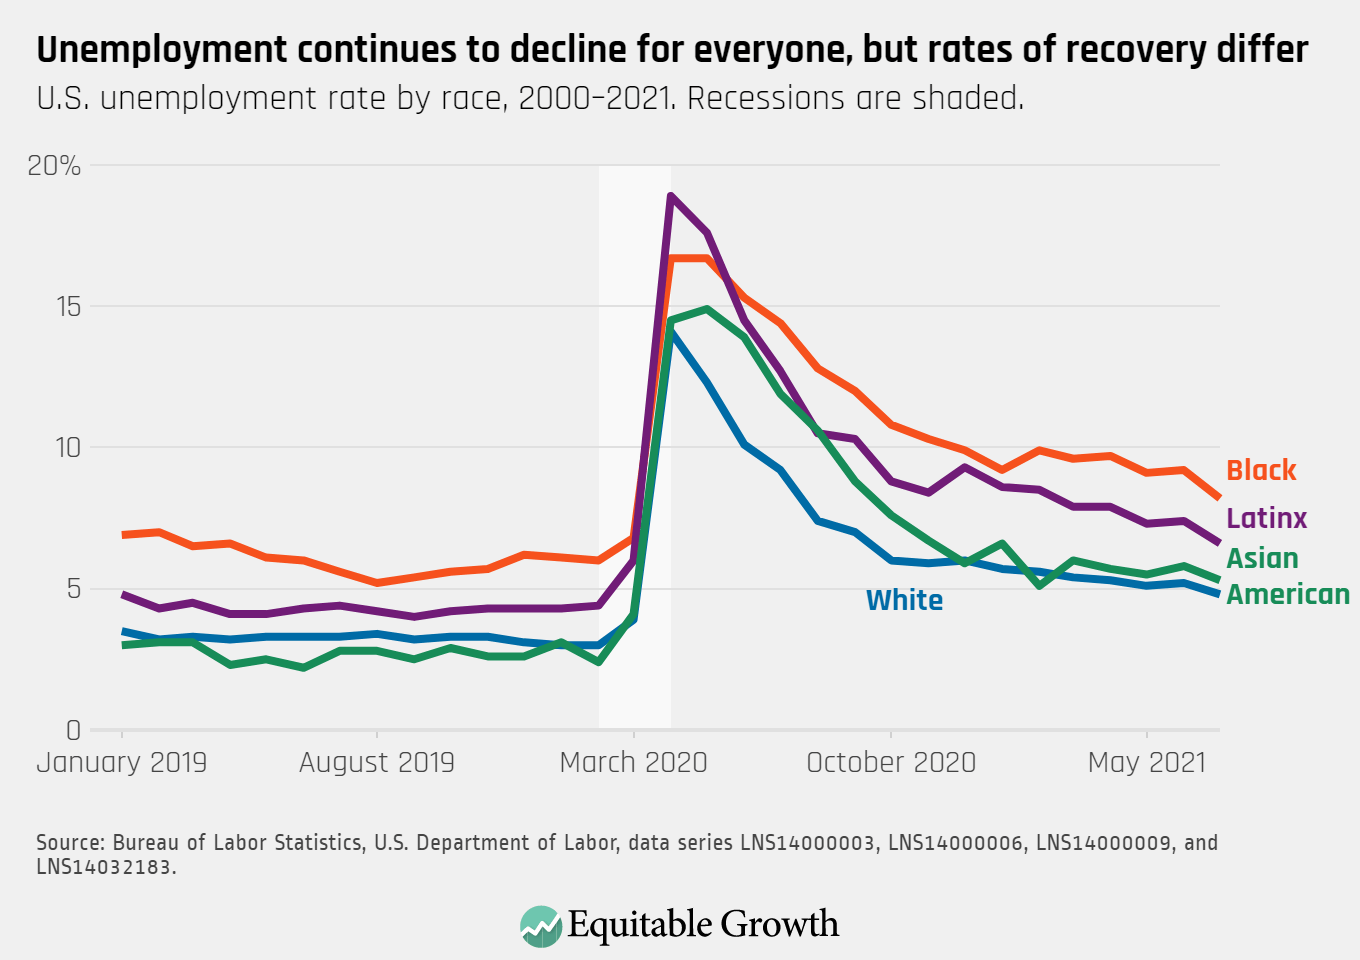
Black and Latinx unemployment rates declined by 1.0 and 0.8 percentage points in July, larger than the decline for both White and Asian American workers, but are still at an elevated level.
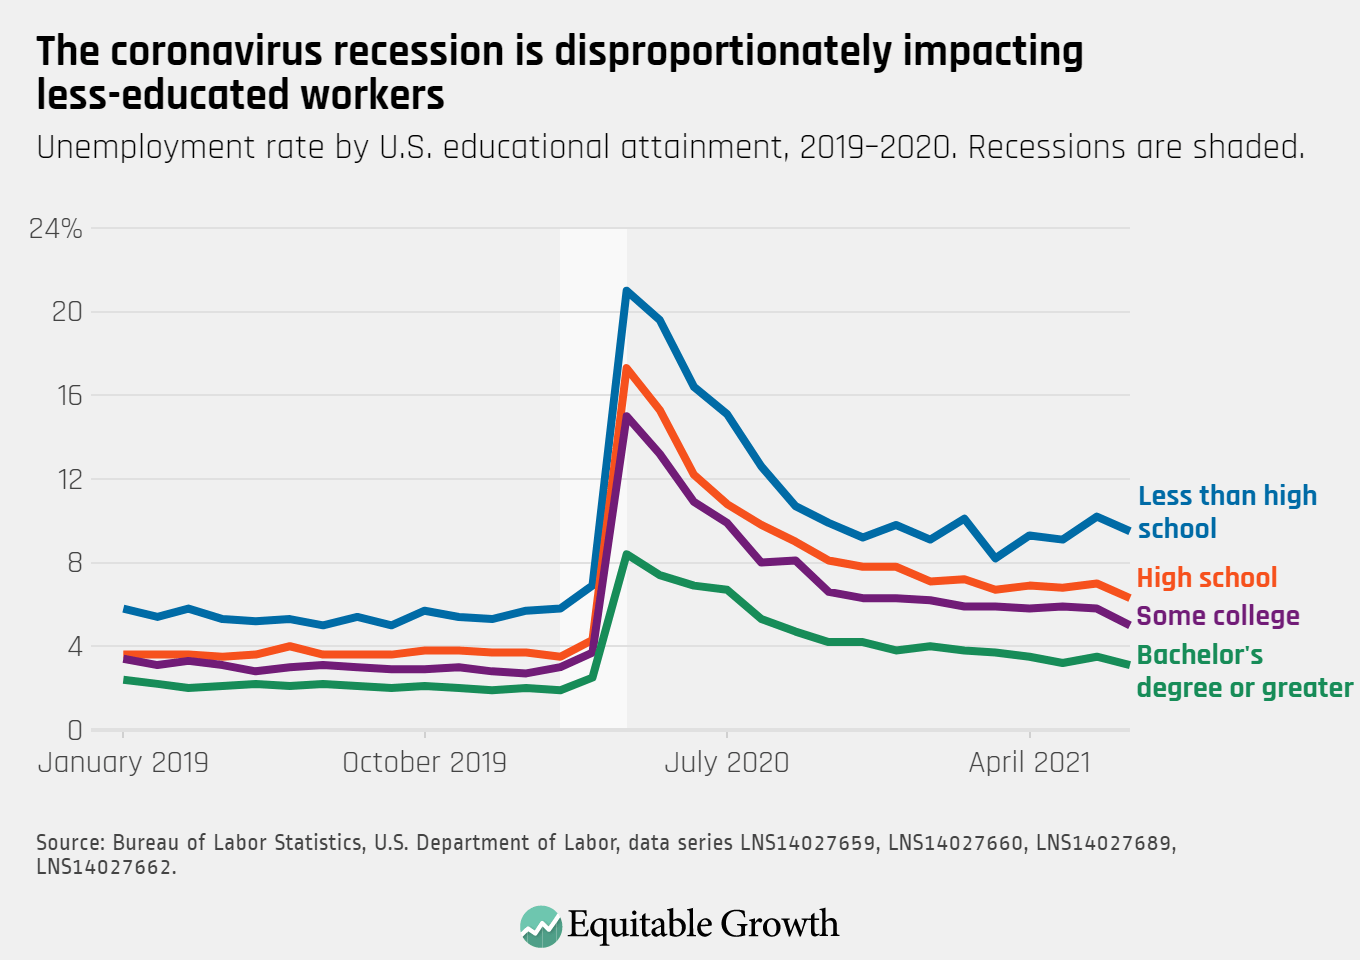
Unemployment fell for workers of all education levels, but partially reflecting a decrease in labor force participation among high school graduates and workers with some college education.
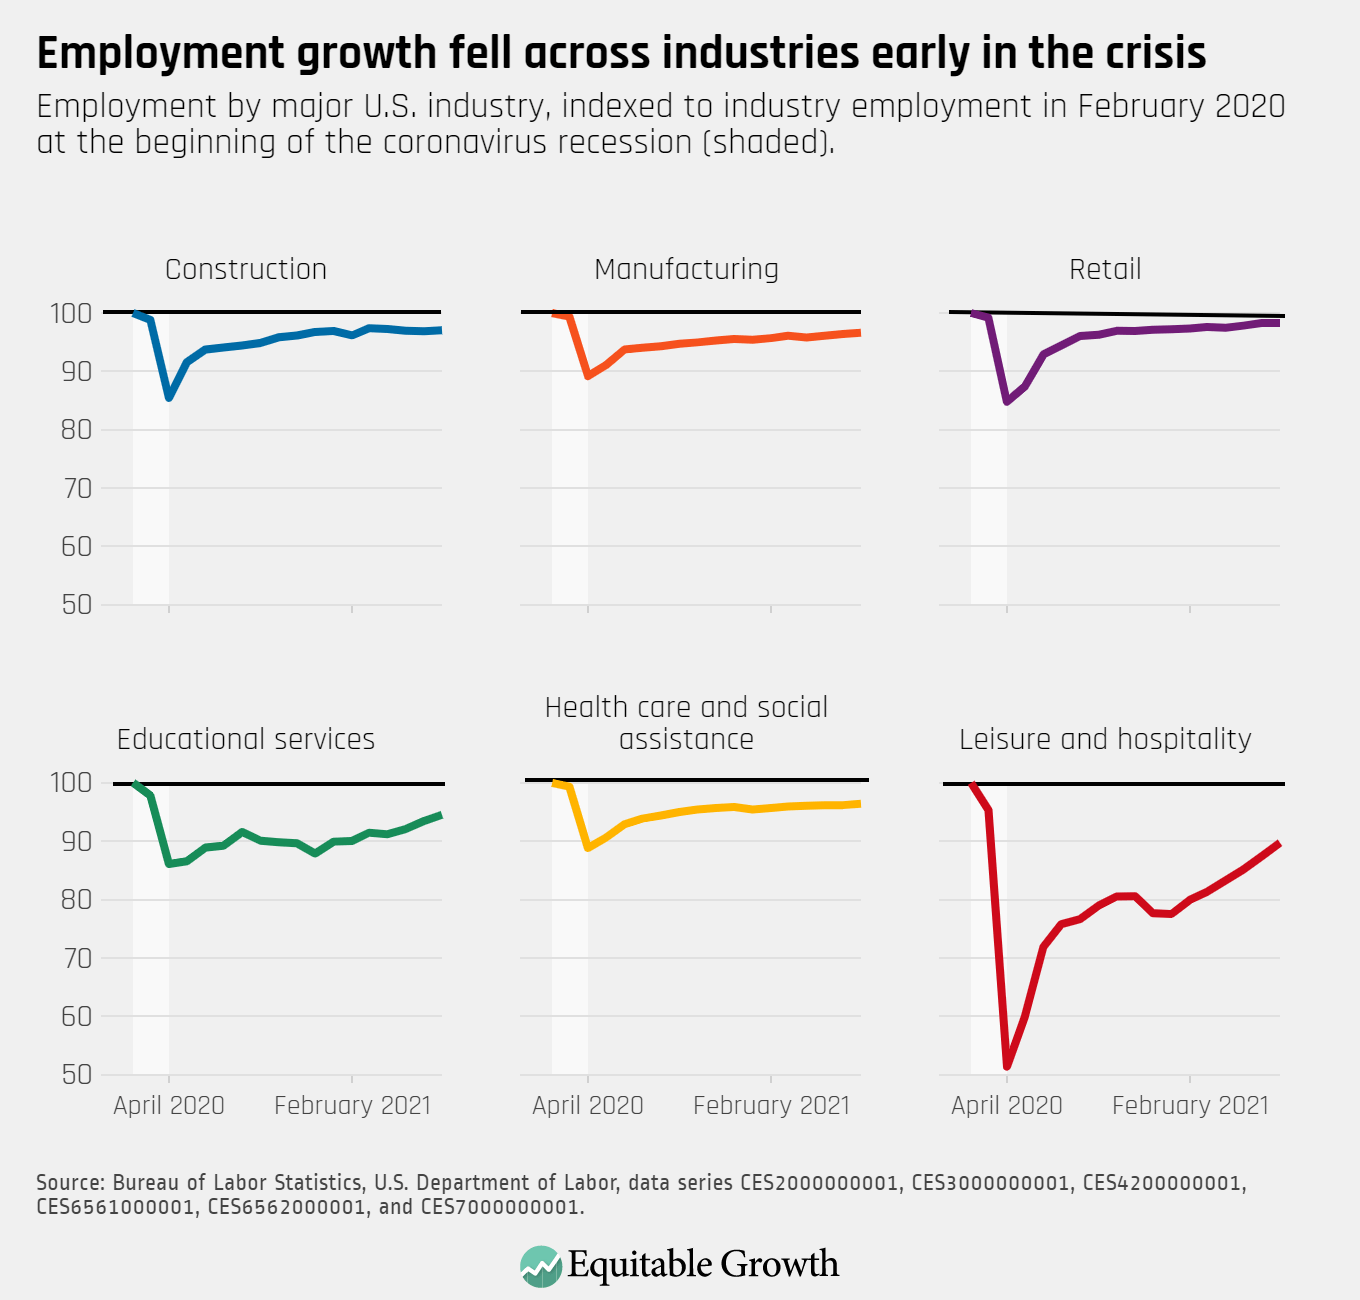
Employment growth continues to be led by leisure and hospitality, which lost the most jobs in the pandemic, but there were also strong gains in education, likely reflecting disrupted patterns of seasonal hiring during the recession.
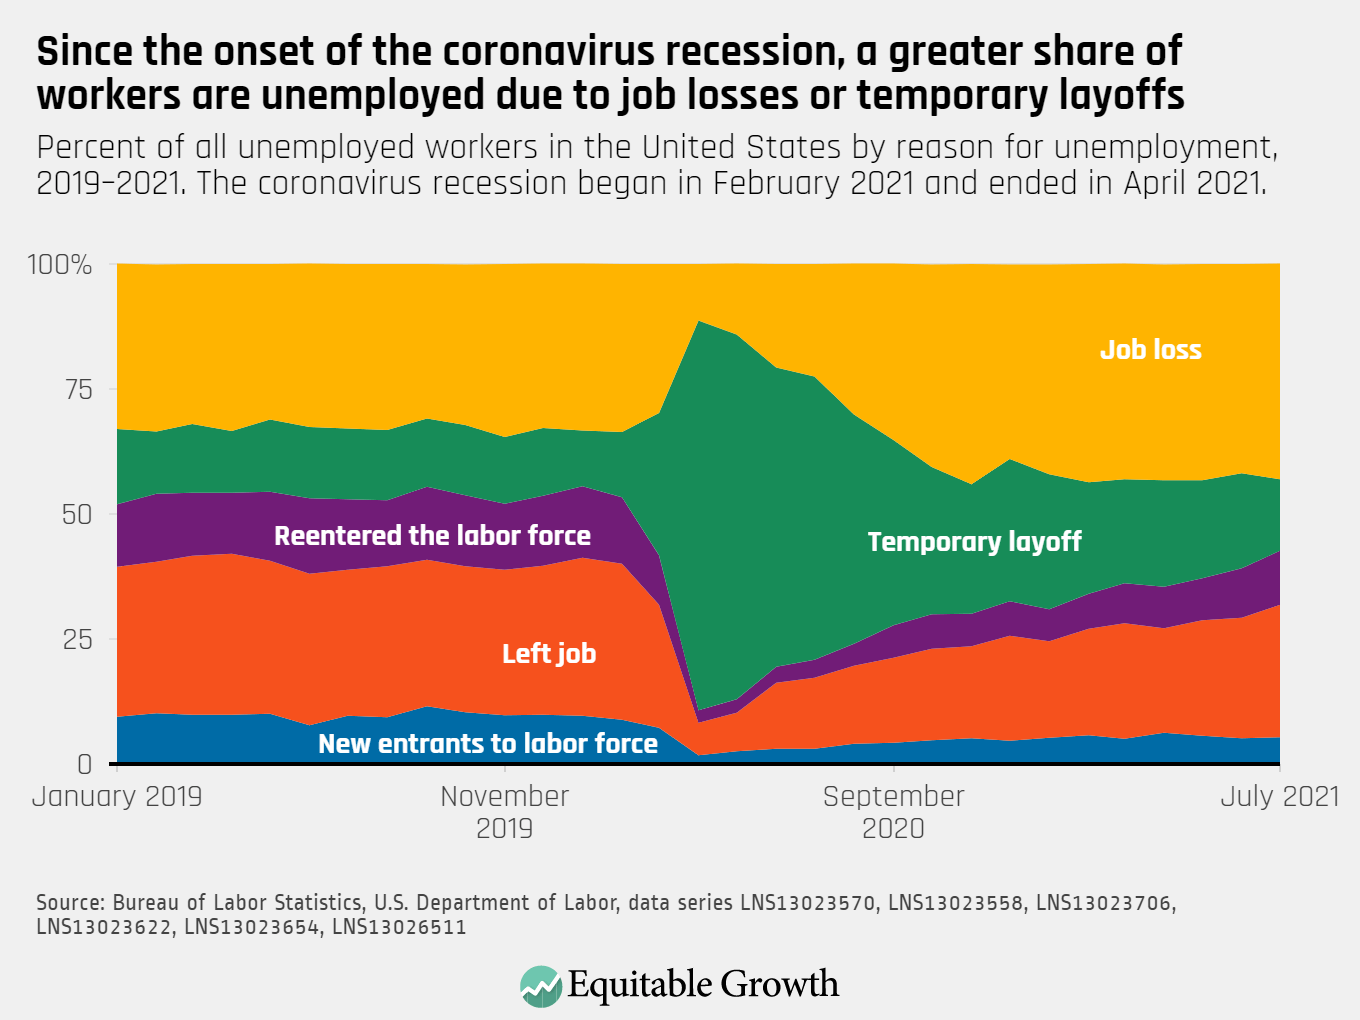
As unemployment declined overall, an increasing proportion of unemployed workers have either voluntarily left their jobs or are reentering the labor force.