Equitable Growth’s Jobs Day Graphs: February 2021 Report Edition
On March 5th, the U.S. Bureau of Labor Statistics released new data on the U.S. labor market during the month of February. Below are five graphs compiled by Equitable Growth staff highlighting important trends in the data.
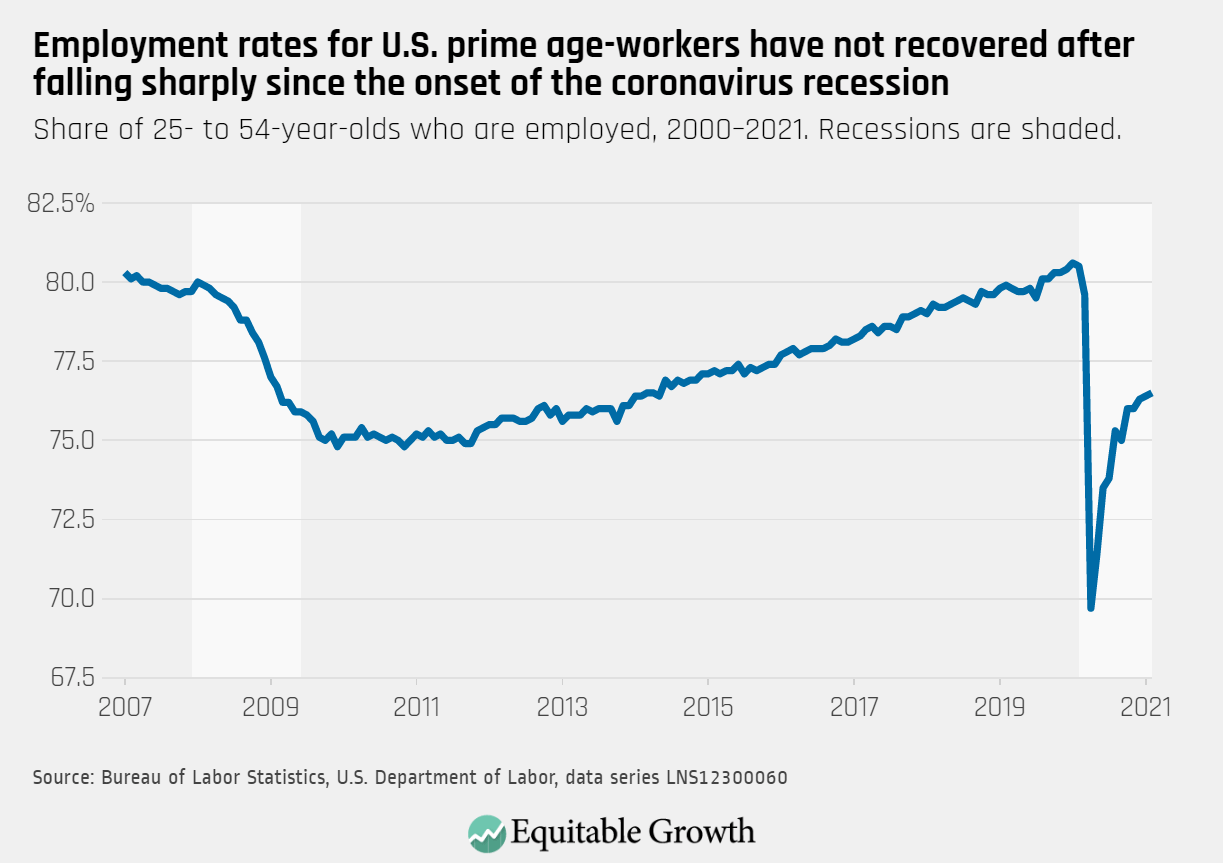
The prime-age employment rate increased slightly from 76.4 percent to 76.5 percent in February, remaining well below pre-crisis levels as the recession continues.
The unemployment rate remains highest for Black and Hispanic workers, while declining for Asian workers and showing little change for White workers.

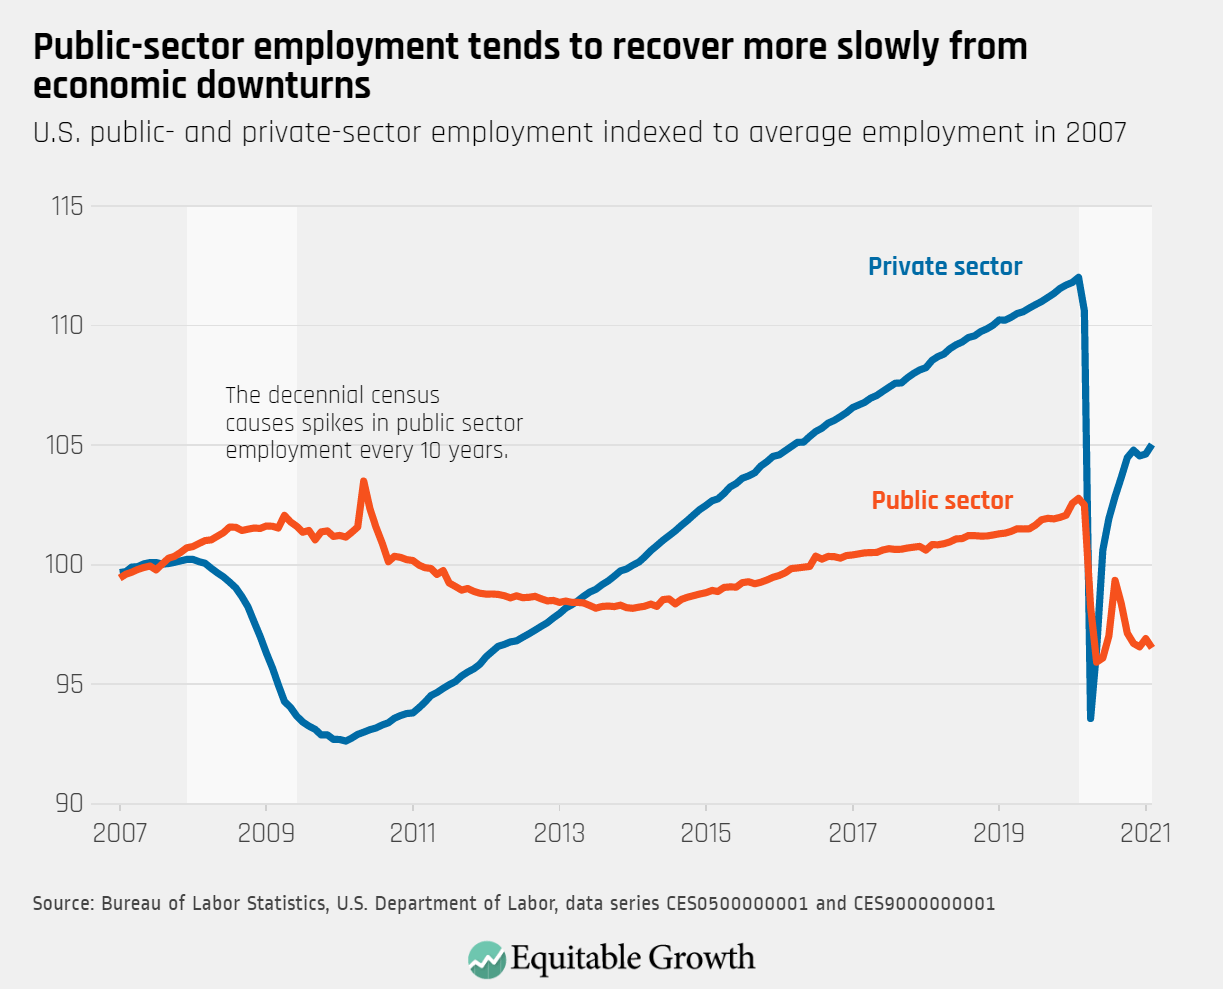
Public-sector employment remains significantly below pre-crisis levels, and has seen little change since the beginning of the year.
The proportion of unemployed U.S. workers facing long-term unemployment continued to rise in February, as 55.6 percent of unemployed workers have now been out of work for more than 15 weeks.

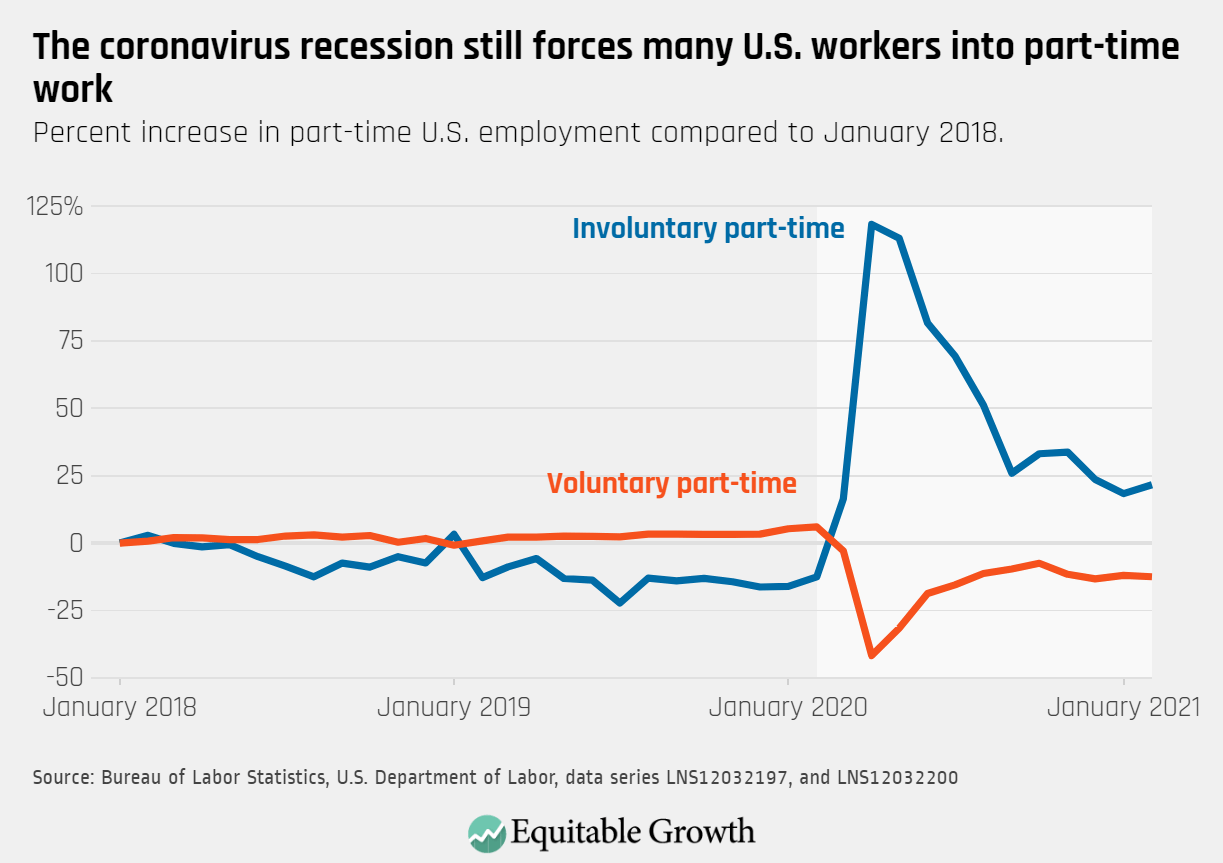
The number of part-time workers who would prefer full-time work remained high in February, with involuntary part-time employment currently at 6.1 million jobs.