Equitable Growth’s Jobs Day Graphs: March 2020 Report Edition
1.
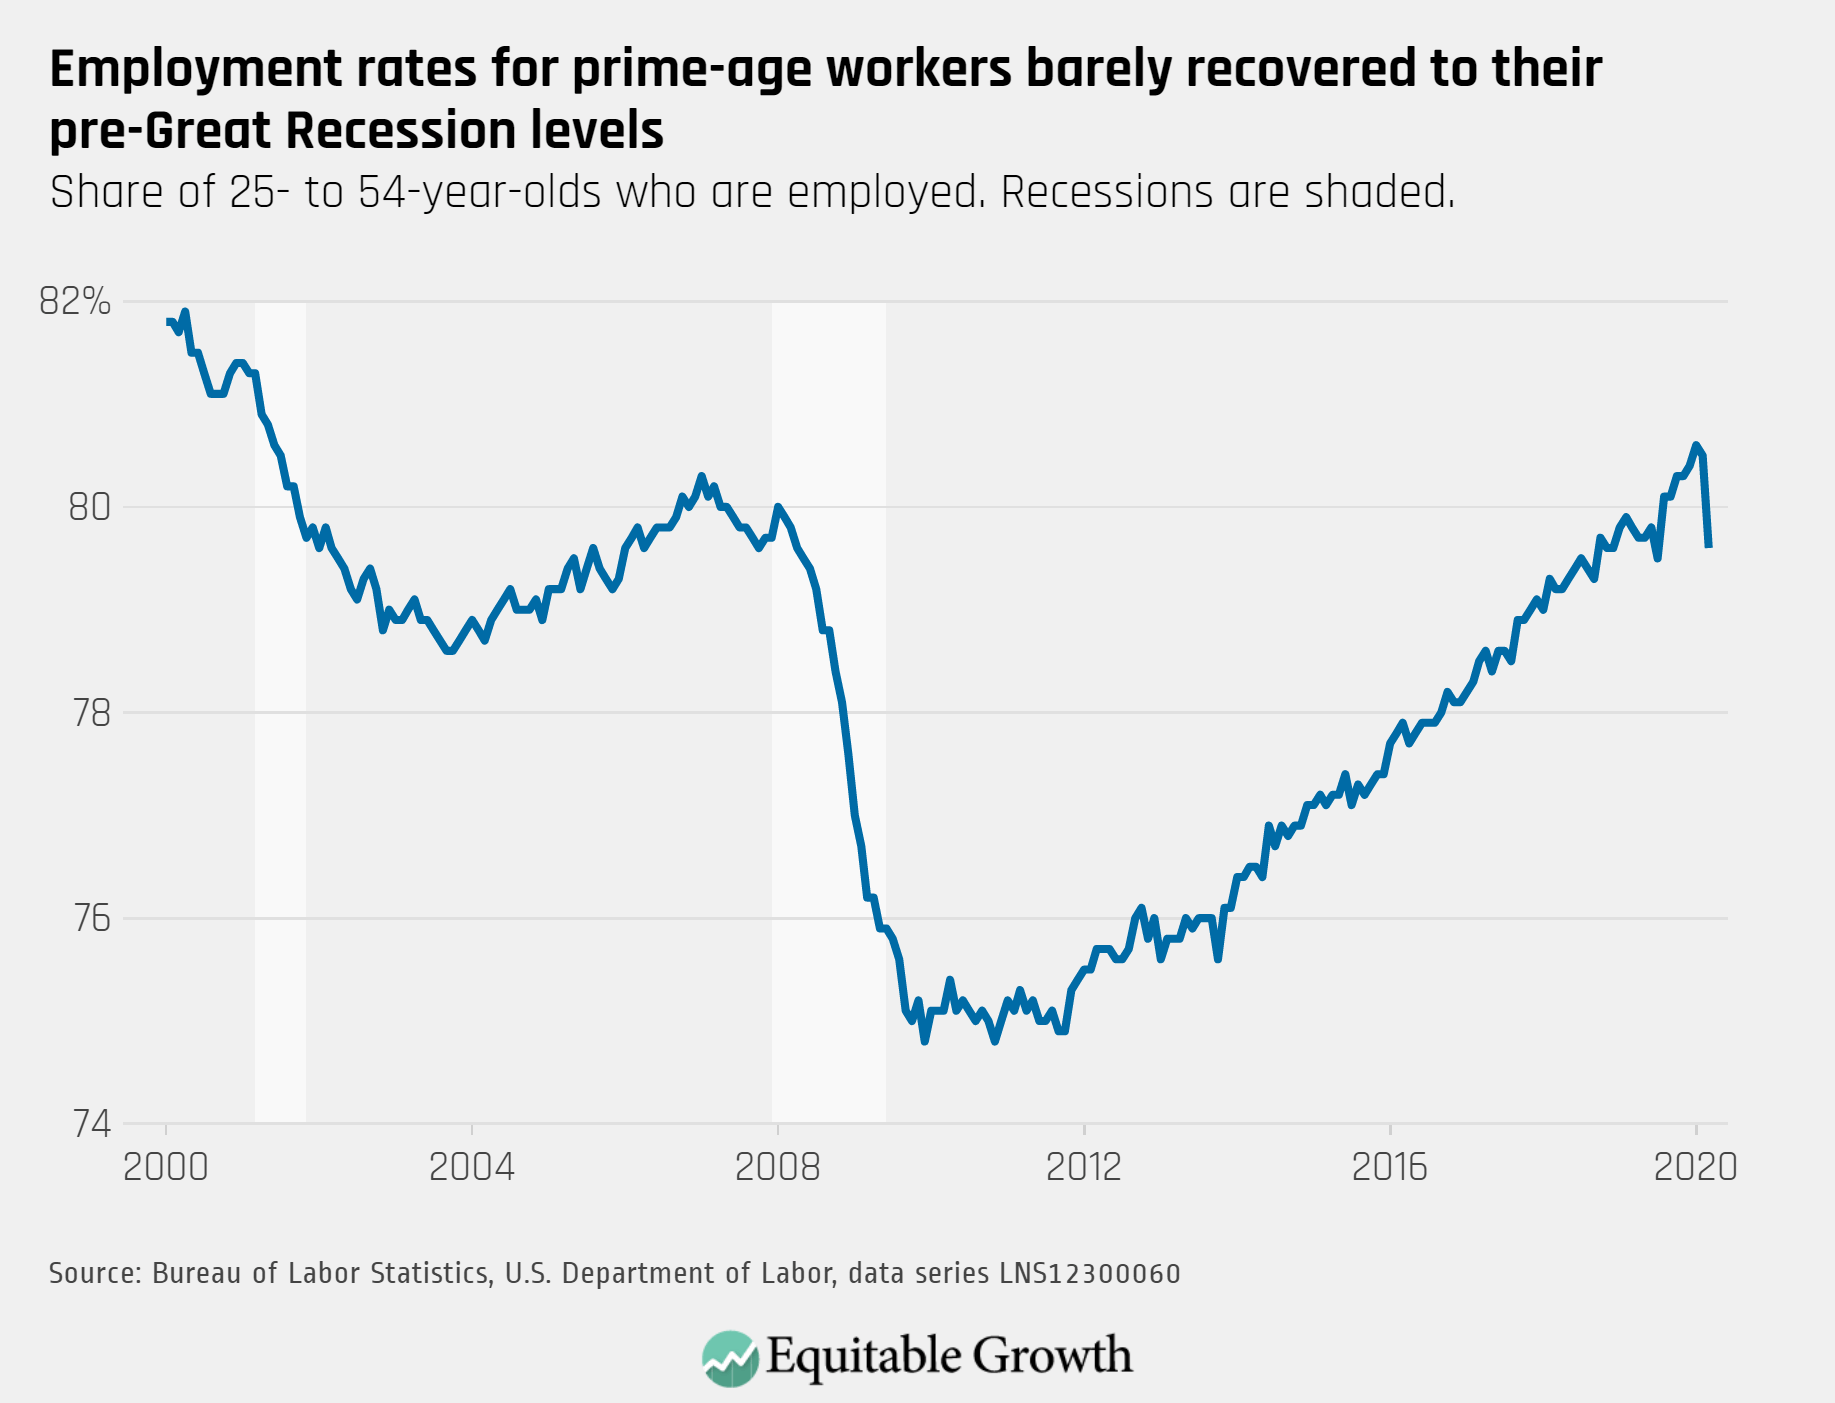
After finally recovering from the Great Recession in recent months, the prime-age employment rate dropped nearly a percentage point from mid-February to mid-March.
2.
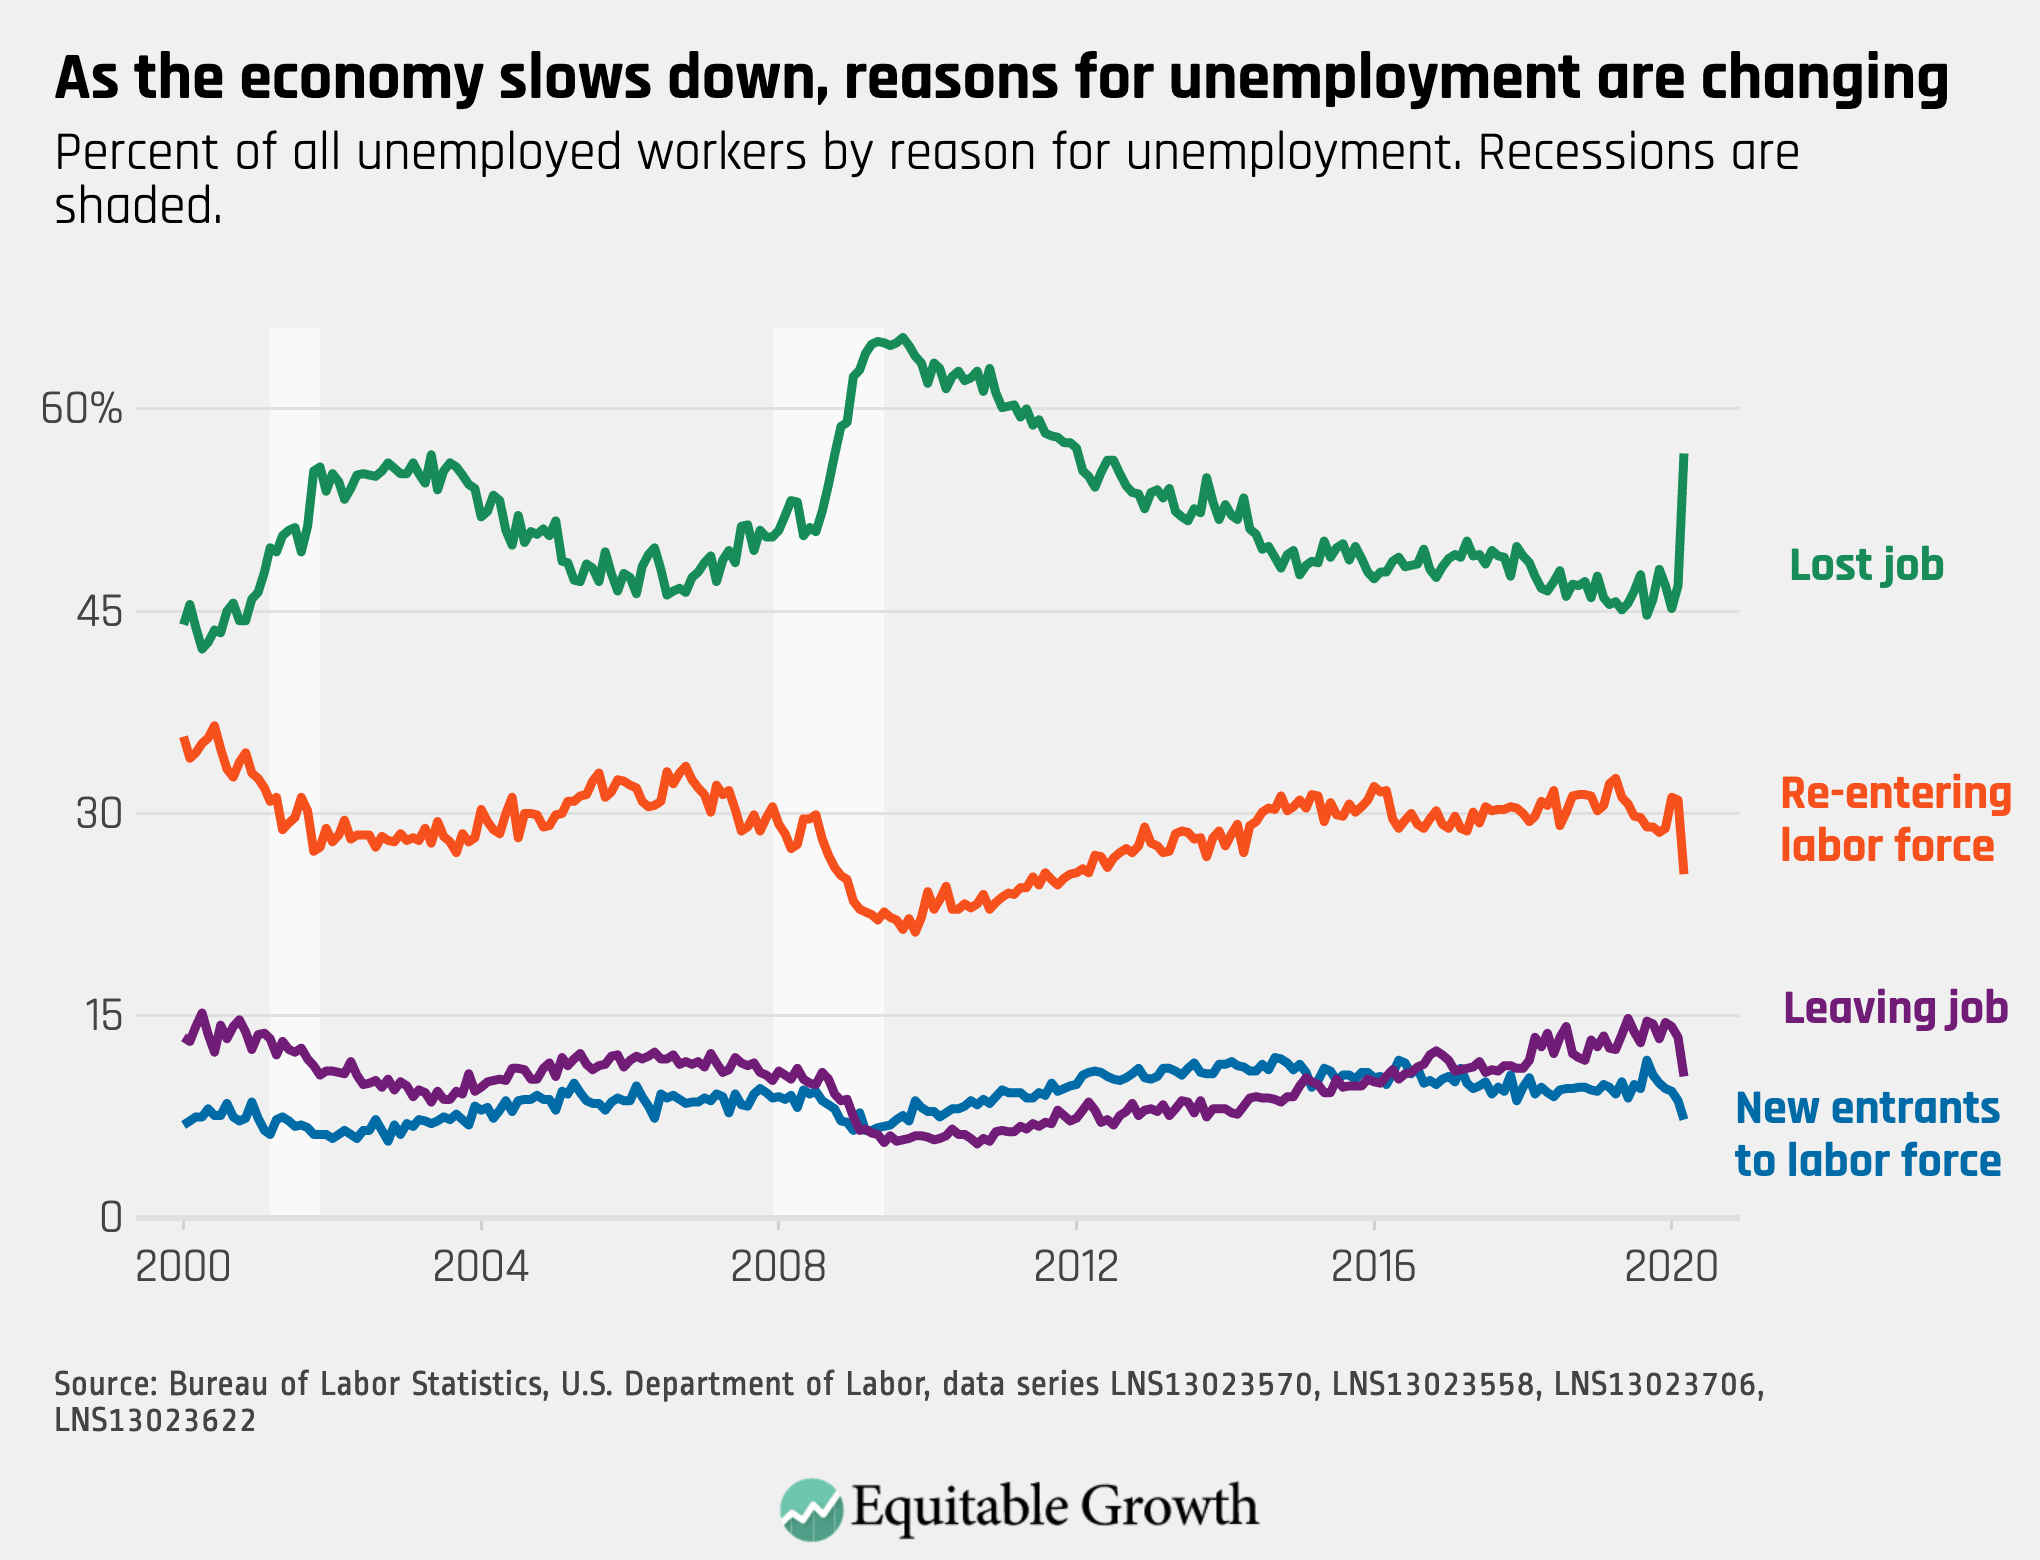
As total unemployment increases, a larger share of unemployed workers have lost their jobs, rather than workers previously out of the labor force looking for work or workers voluntarily leaving their jobs.
3.
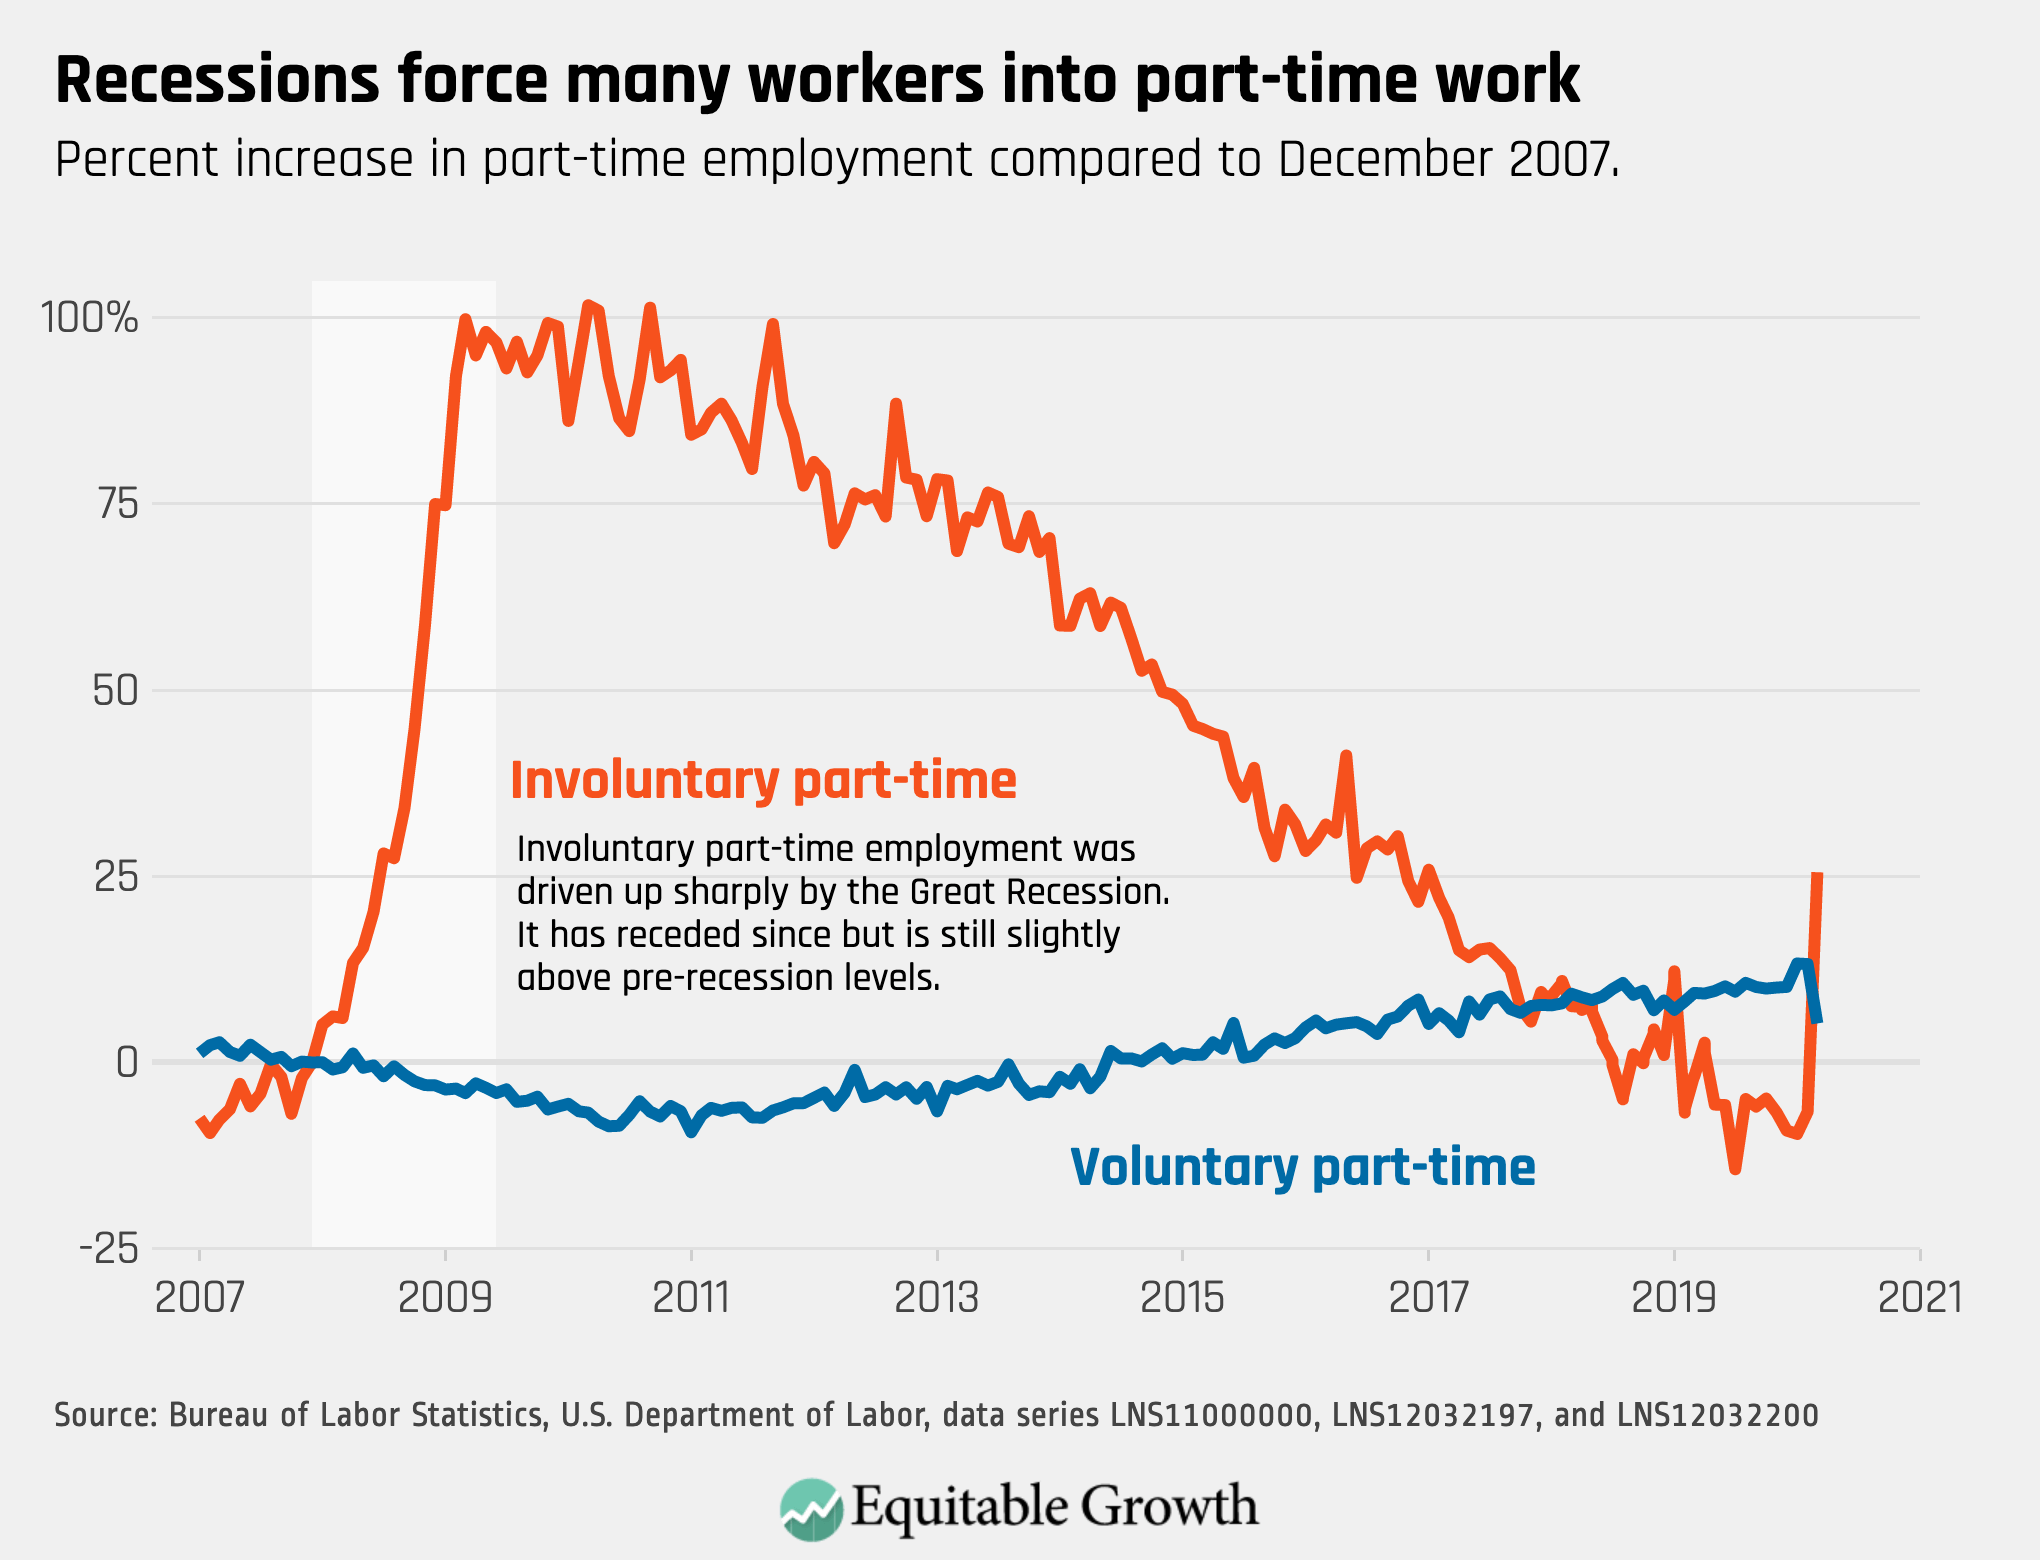
Involuntary part-time work surged in March, as an increase in part-time work is an indicator of an unhealthy labor market.
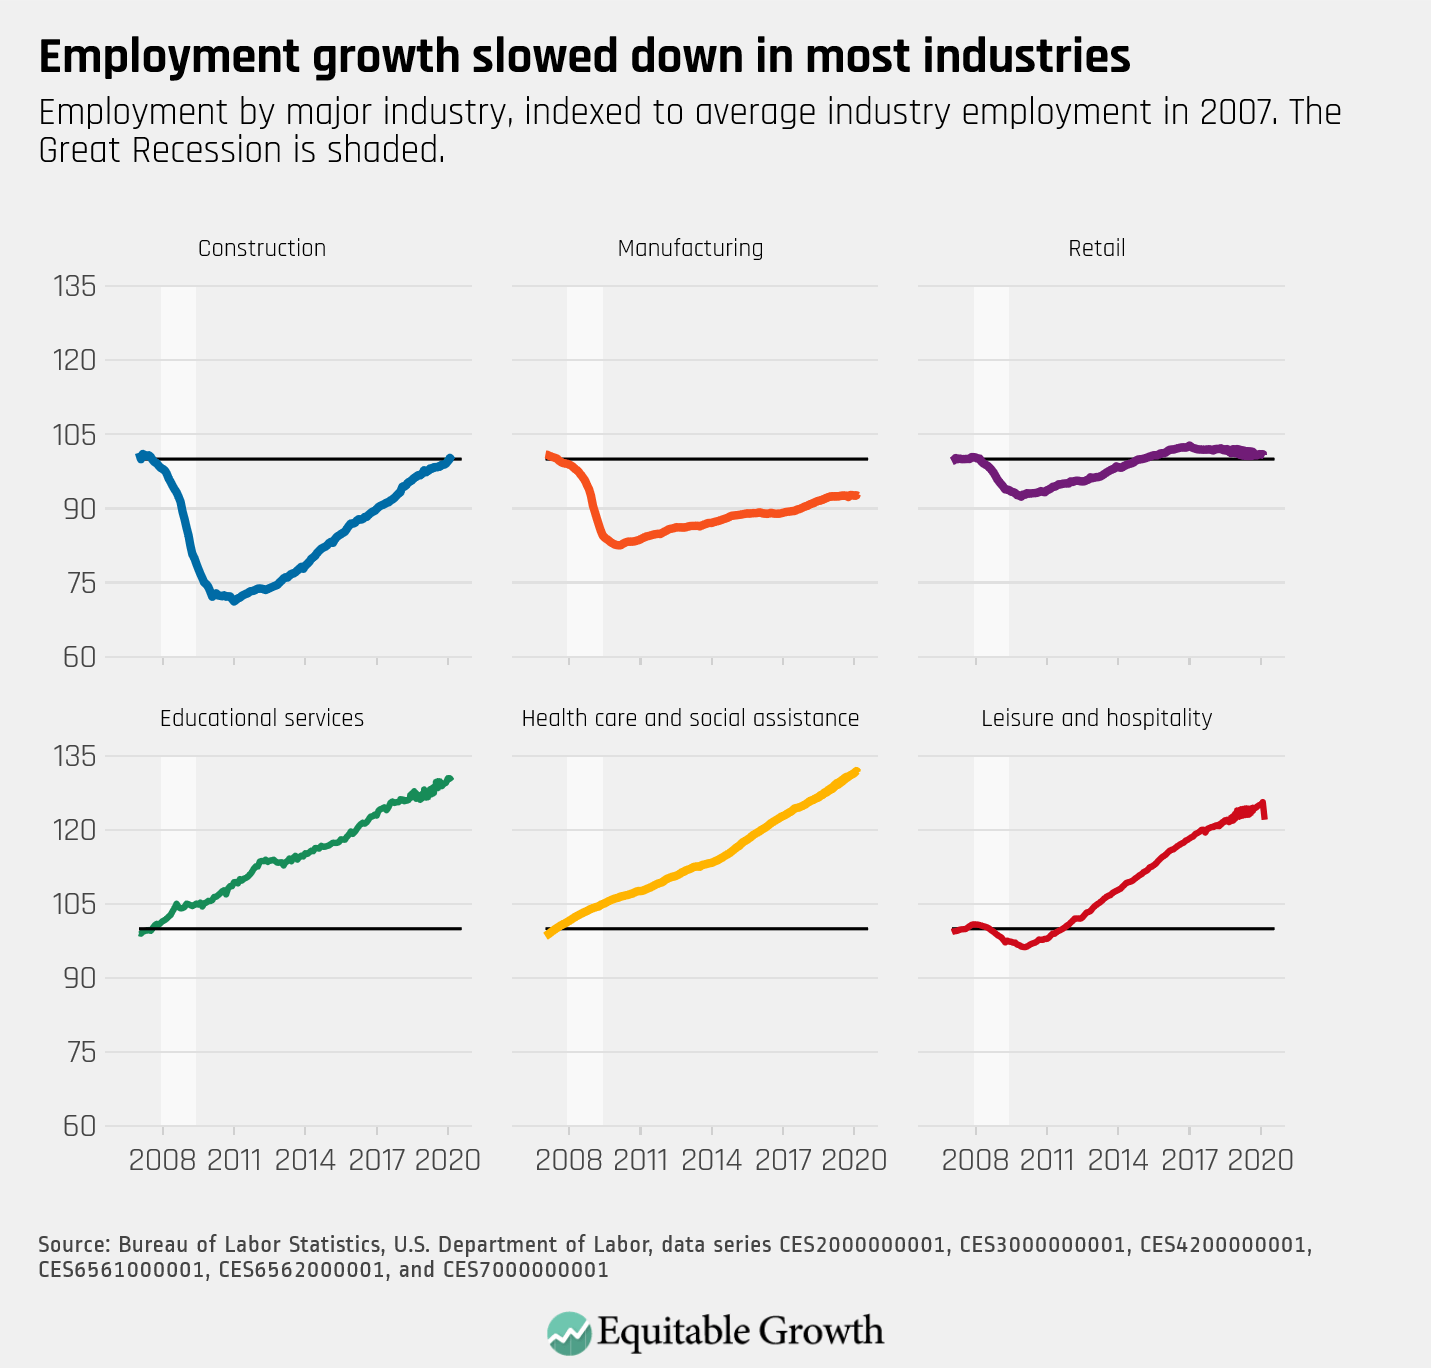
4.
Declining employment was led by the leisure and hospitality industry, which shed 459,000 jobs by mid-March.
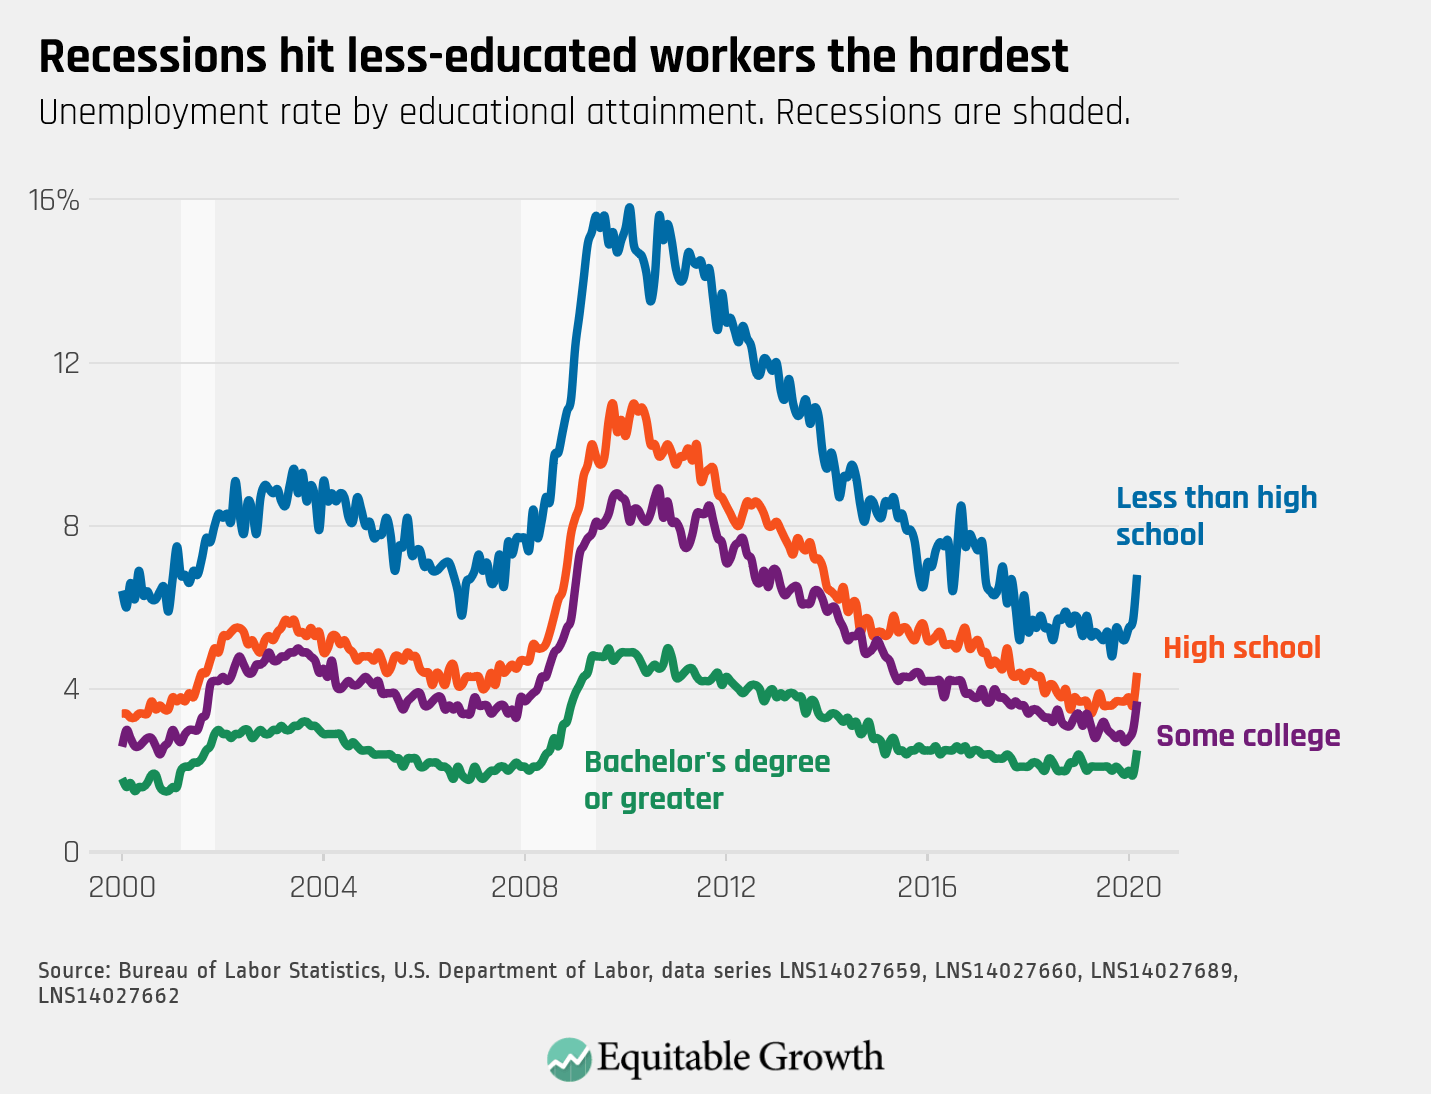
5.
Increases to the unemployment rate in March were marginally greater for those with less education.