JOLTS Day Graphs: December 2019 Report Edition
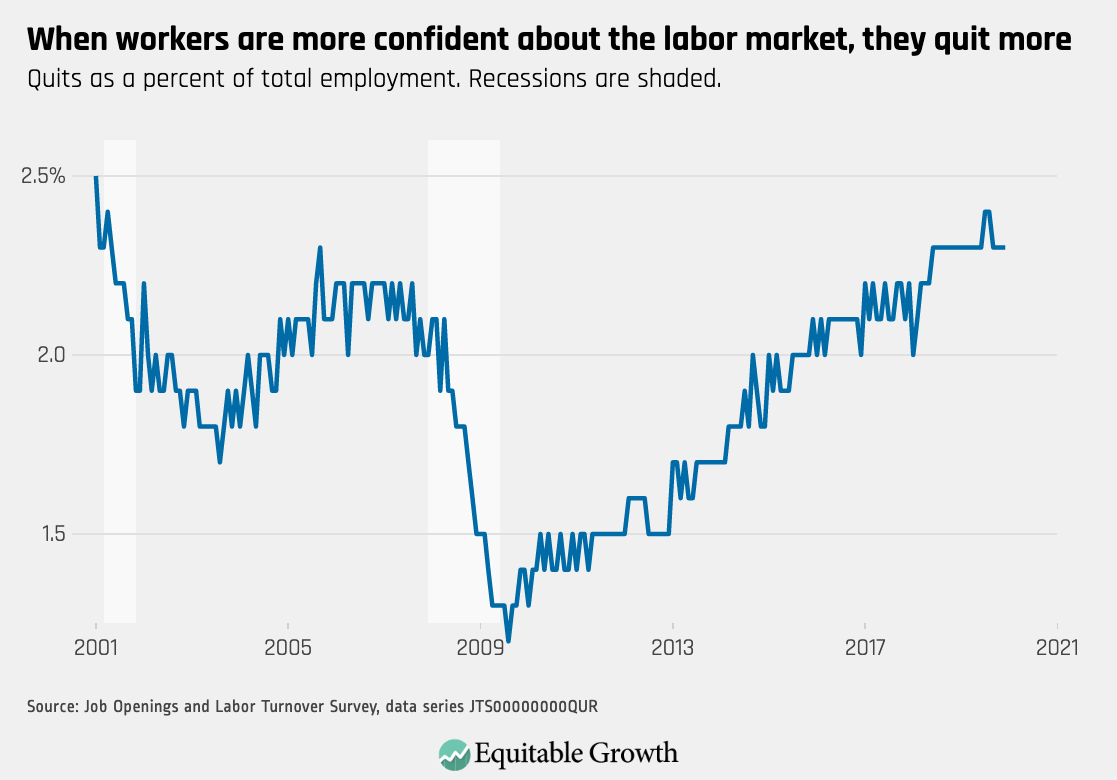
1.
The quits rate remain unchanged at 2.3% in December, reflecting workers’ confidence in the labor market despite a slight decrease in job openings by 364,000.
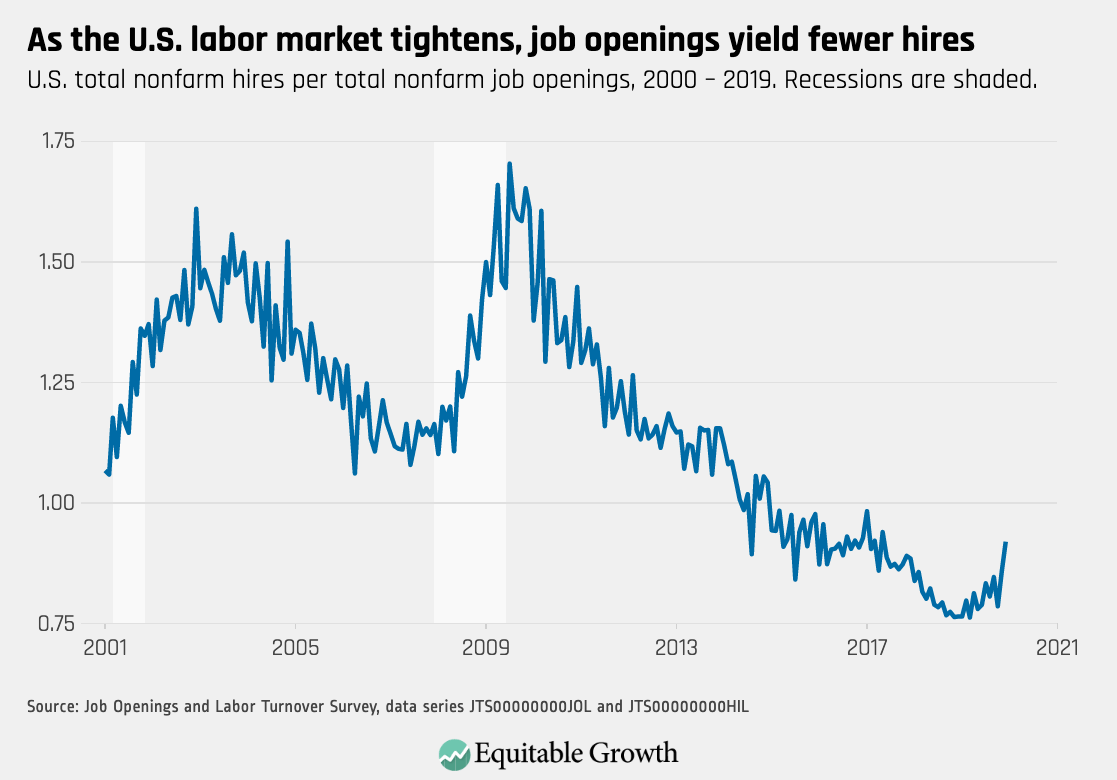
2.
The ratio of hires per job openings increased due to the decline in openings, while the level of hires changed little.
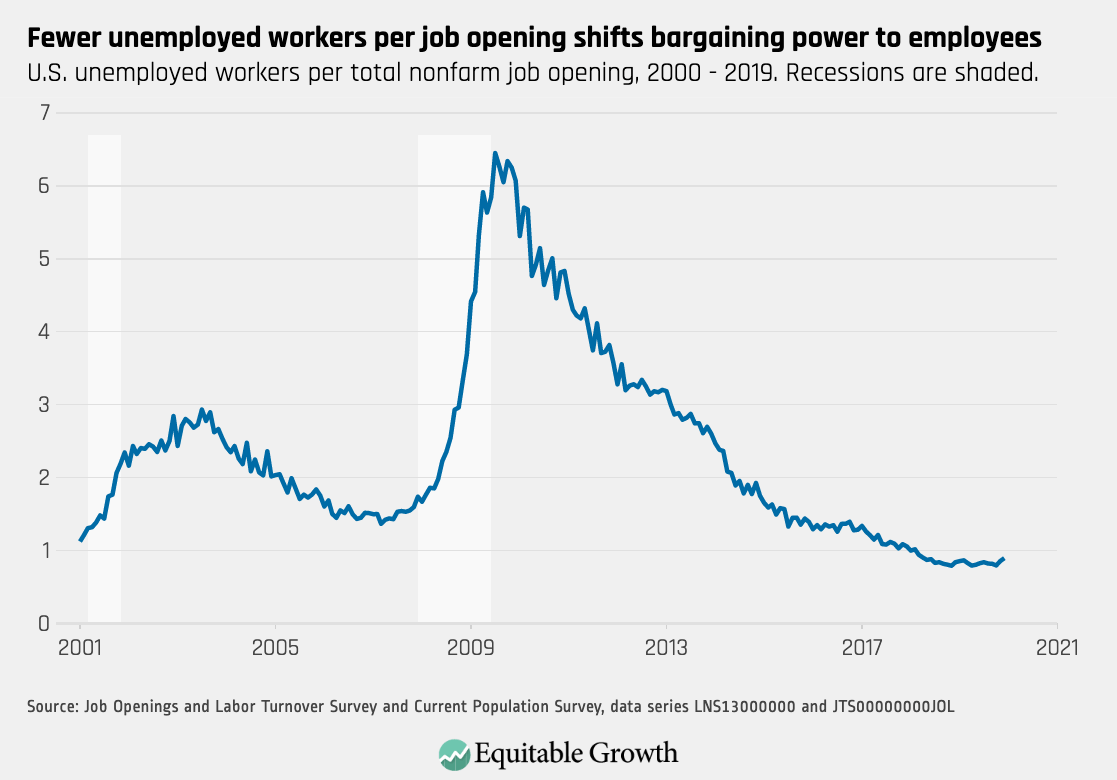
3.
The ratio of unemployed workers to job openings continued to edge up as openings declined for the second month in a row, but remains at less than one unemployed worker looking for a job for each available job opening.
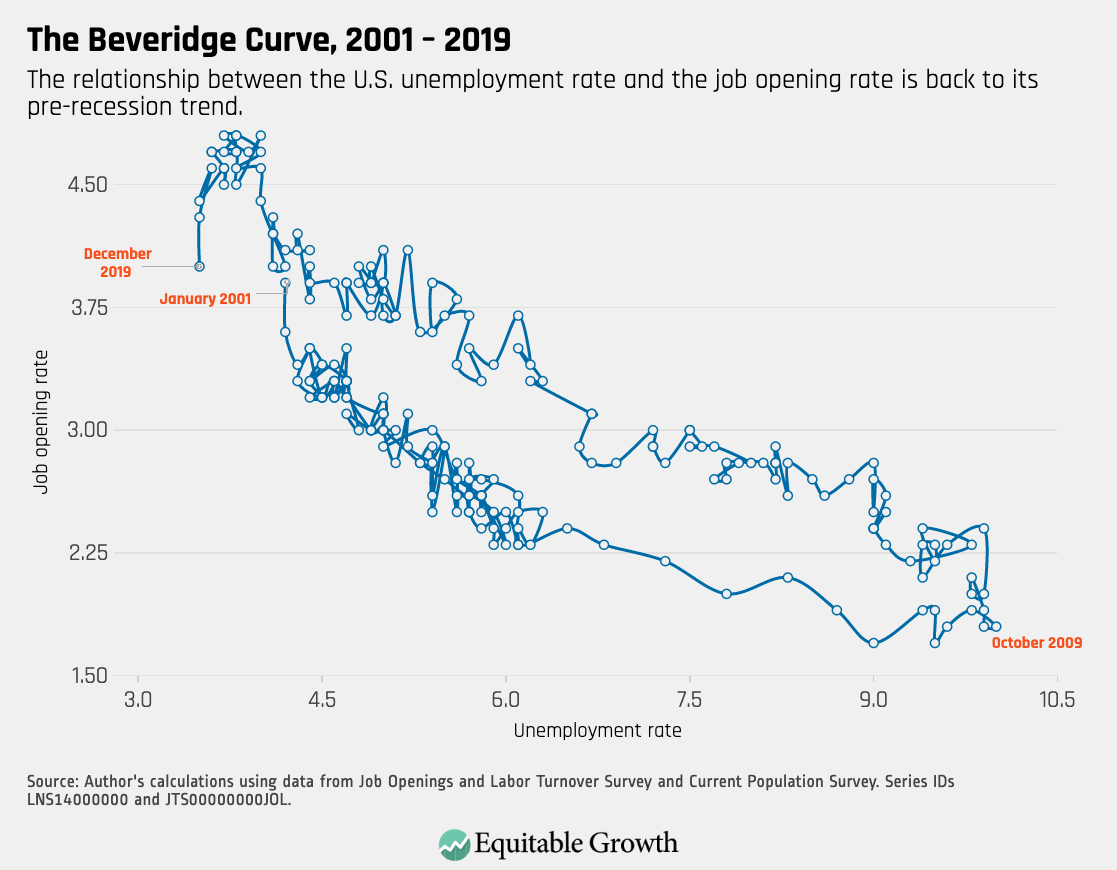
4.
The Beveridge Curve moved downward in December, but continues to reflect an expansionary labor market with low unemployment.