JOLTS Day Graphs: April 2018 Report Edition
Every month the U.S. Bureau of Labor Statistics releases data on hiring, firing, and other labor market flows from the Job Openings and Labor Turnover Survey, better known as JOLTS. Today, the BLS released the latest data for April 2018. This report doesn’t get as much attention as the monthly Employment Situation Report, but it contains useful information about the state of the U.S. labor market. Below are a few key graphs using data from the report.
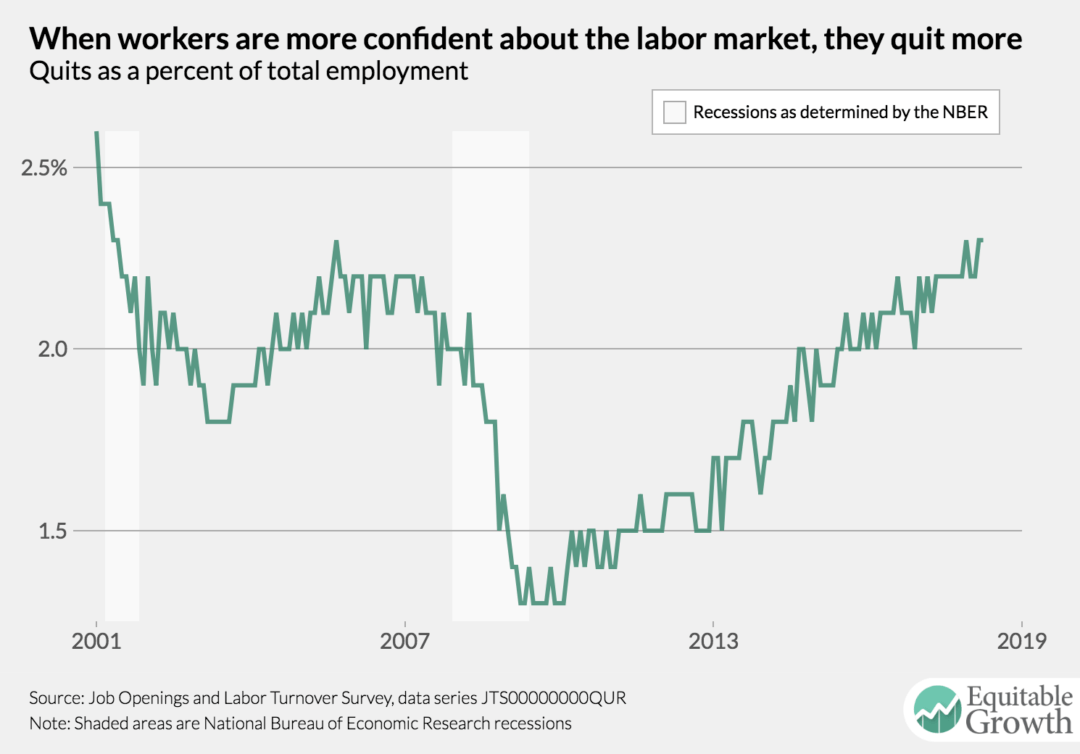
The quits rate stayed steady at 2.3 percent in April, an indication that quitting has seemingly increased and may continue to do so.
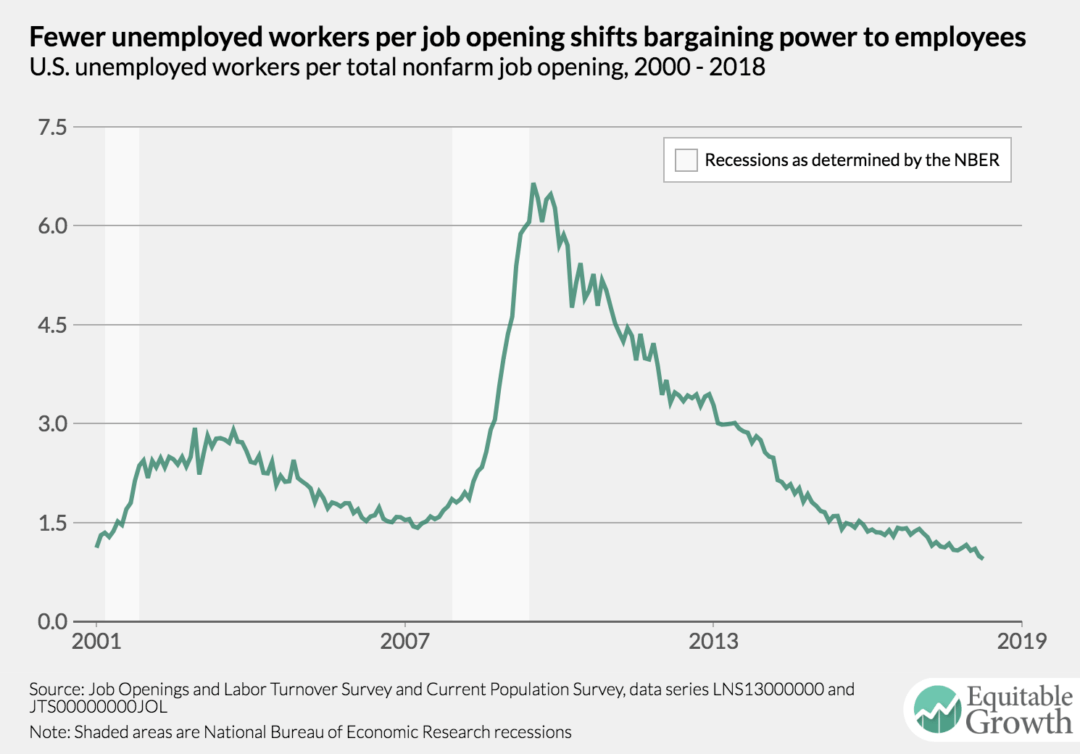
The ratio of unemployment-to-job openings was 0.95 in April, breaking the significant barrier of 1.0. A ratio this low means there were more vacant jobs than officially unemployed workers in April.
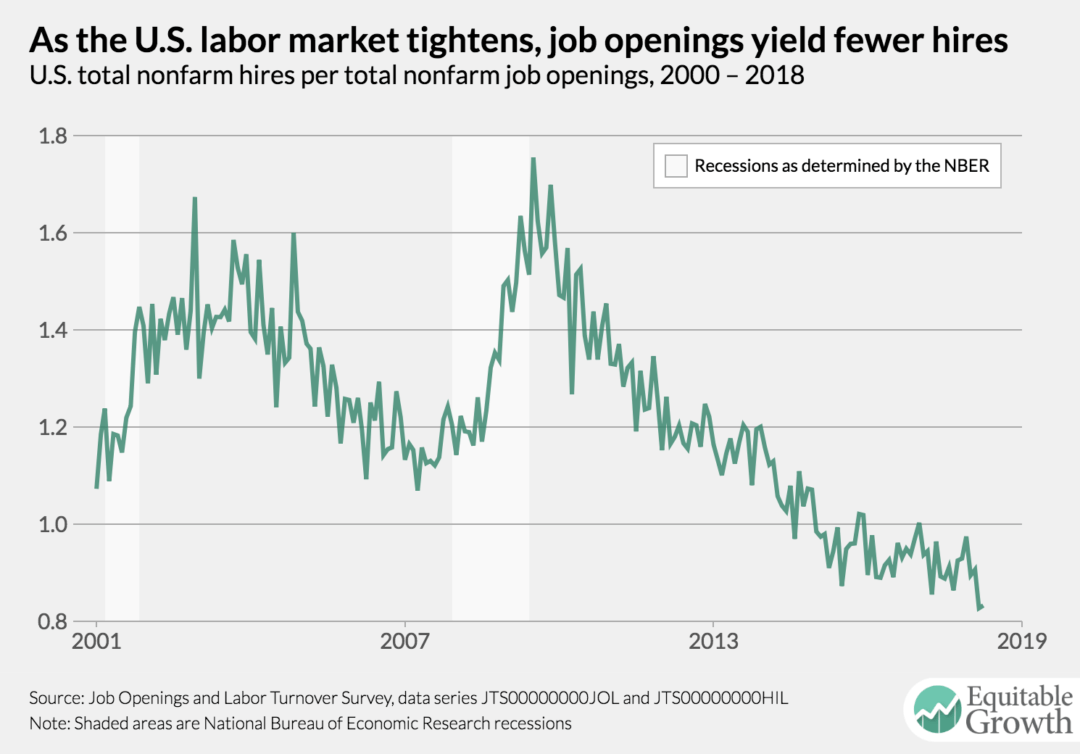
The vacancy yield, or the job-filling rate, slightly increased. But the number of hires per job openings is historically low and the current trend is slightly downward.
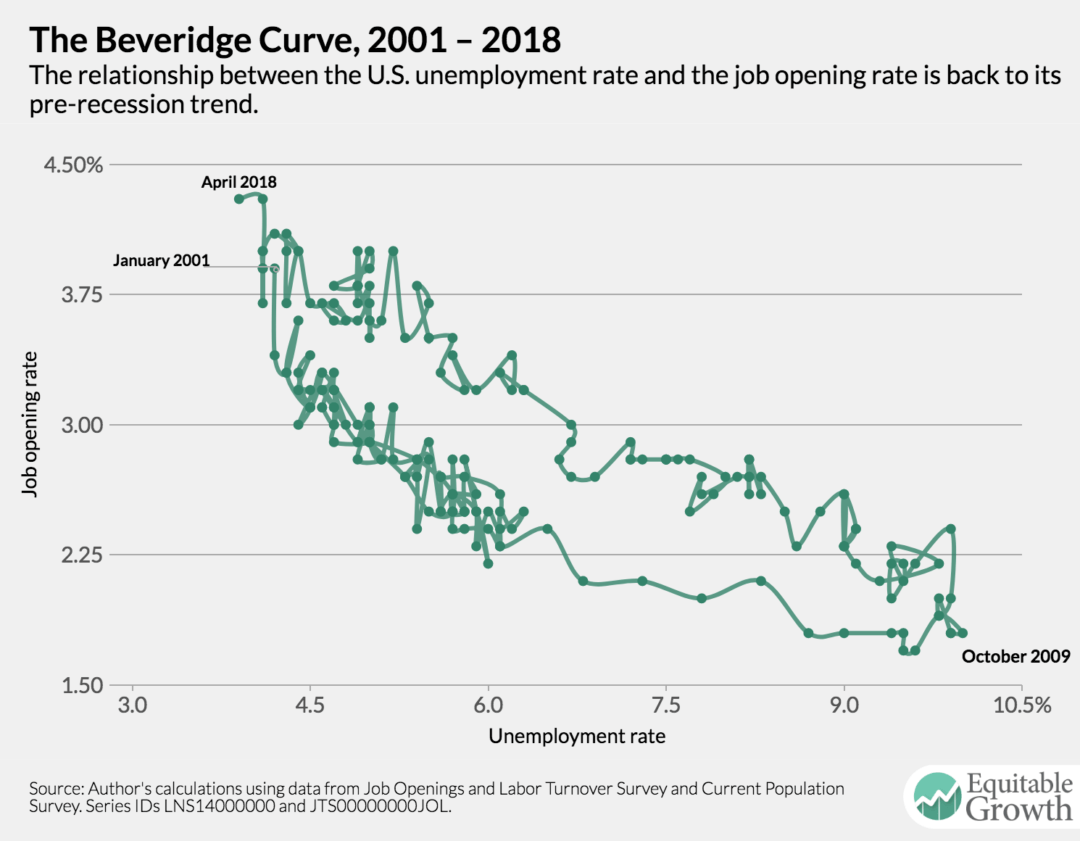
The Beveridge Curve, which is supposed to indicate the unemployment rate for a given amount of job openings, has returned to its pre-recession relationship.