U.S. income inequality persists amid overall growth in 2014
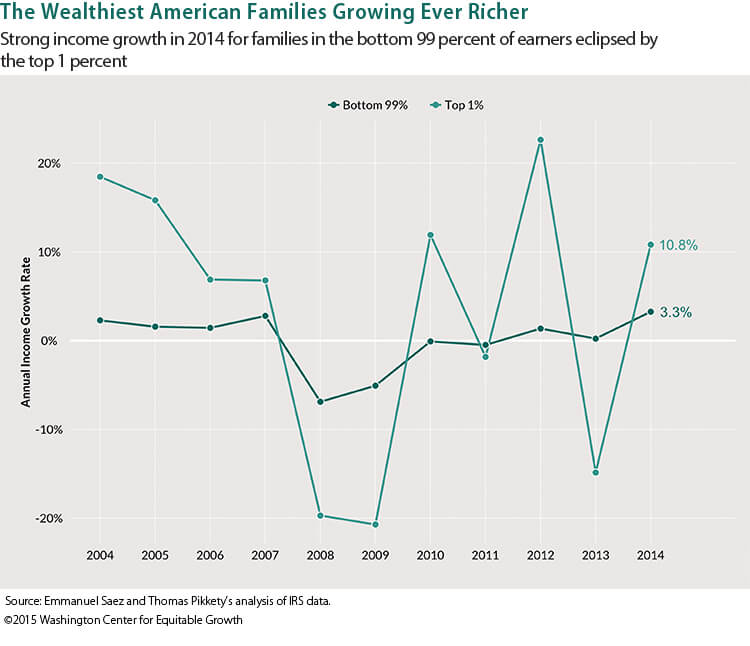
Income inequality in the United States grew more acute in 2014, yet the bottom 99 percent of income earners registered the best real income growth (after factoring in inflation) in 15 years. The latest data from the U.S. Internal Revenue Service show that incomes for the bottom 99 percent of families grew by 3.3 percent over 2013 levels, the best annual growth rate since 1999. But incomes for those families in the top 1 percent of earners grew even faster, by 10.8 percent, over the same period. (See Figure 1.)
Figure 1

Overall, real average incomes per family in 2014 grew by a substantial 4.8 percent. For the bottom 99 percent of income earners, this marks the first year of real recovery from the income losses sparked by the Great Recession of 2007-2009. After a large decline of 11.6 percent from 2007 to 2009, those families saw a negligible 1.1 percent in real income gains from 2009 to 2013. But a full recovery in income growth for the bottom 99 percent is still not in sight. In 2014, these families recovered slightly less than 40 percent of their income losses due to the Great Recession.
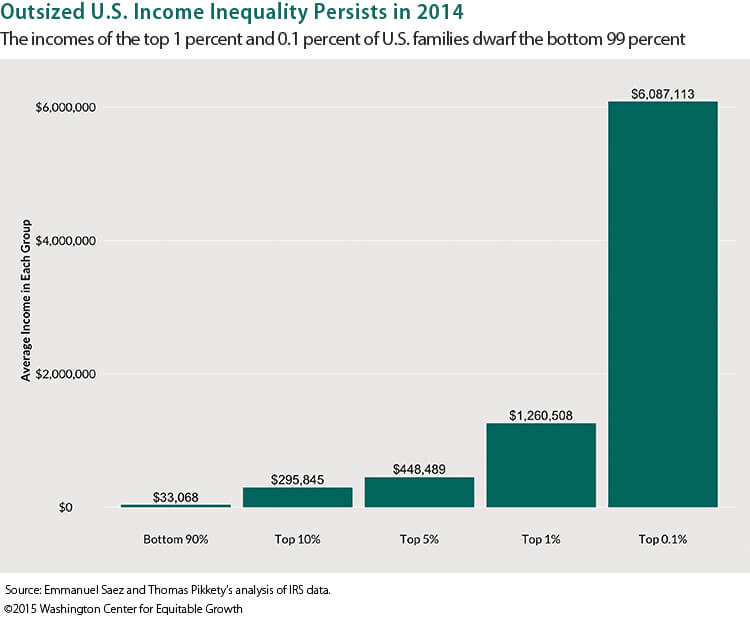
Those at or near the top of the income ladder did substantially better in 2014. The share of income going to the top 10 percent of income earners—individuals making an average of $300,000 a year—increased to 49.9 percent in 2014 from 48.9 percent in 2013, the highest ever except for 2012. The share of income going to the top 1 percent of families—those earning on average about $1.3 million a year—increased to 21.2 percent in 2014 from 20.1 percent in 2013. Income inequality, then, remains extremely high, particularly at the very top of the income ladder. (See Figure 2.)
Figure 2

More broadly, the top 1 percent of families captured 58 percent of total real income growth per family from 2009 to 2014, with the bottom 99 percent of families reaping only 42 percent.
The release time for this latest income data from the IRS usually lags behind other key indicators of U.S. economic performance. Aggregate economic growth statistics are typically available a month after the end of each quarter. In contrast, U.S. Census Bureau official income and poverty measures are not available until mid-September of the following year, or 8.5 months after the end of the year. Complete individual income tax statistics, the only statistics that can capture top incomes, are usually not available until 19 months after the end of the year.
This difference in timing explains why economic growth statistics are much more widely discussed than income inequality statistics in public debates about economic inequality and growth. But for the first time, this income data is now more readily available because the Statistics of Income division of the IRS now publishes filing-season statistics by size of income. These statistics can be used to project the distribution of incomes for the full year.
My colleagues and I used these new statistics to update our top income share series for 2014, which are part of our World Top Incomes Database. These statistics measure pre-tax cash market income excluding government transfers such as the disbursal of the earned income tax credit to low-income workers. For the first time, we can produce inequality statistics less than 6 months after the end of the year.
Timely statistics on economic inequality are central to informing the public policy debate about the connections between economic growth and inequality. One case in point: The higher tax rates for top U.S. income earners enacted in 2013 as part of the Obama Administration and Congress’ federal budget deal seem to have had only a fleeting impact on the outsized accumulation of pre-tax income by families in the top 1 percent and 0.1 percent of income earners.
To be sure, there was a shifting of income among high-income earners from 2013 to 2012 as these wealthy families sought to avoid the higher rates enacted in 2013. This adjustment created a spike in the share of top incomes accumulated by the very wealthy in 2012 followed by a trough in 2013. By 2014, however, top incomes shares were back to their upward trajectory. This suggests that the higher tax rates starting in 2013, while not negligible, will not be sufficient by themselves to curb the enormous increase in pre-tax income concentration that has taken place in the United States since the 1970s.
—Emmanuel Saez in a professor of economics at the University of California-Berkeley and a member of the Washington Center for Equitable Growth’s steering committee
