The employment effects of a much higher U.S. federal minimum wage: Lessons from other rich countries
Overview
Not long ago, most U.S. economists agreed that a statutory minimum wage with any “bite”—any meaningful effect on wages at the bottom of the labor market—would cause job losses and lead to a reduction in aggregate employment opportunities for low-wage workers. But as a result of path-breaking research by leading economists (first David Card at the University of California-Berkeley and Alan Krueger at Princeton University, and then by Arindrajit Dube at the University of Massachusetts-Amherst and Michael Reich at University of California-Berkeley and their associates, that has changed. Today, a vast majority of economists now understand that modest increases in the (currently very low) federal minimum wage would have little or no effect on overall job opportunities for minimum wage workers.
Download FileThe employment effects of a much higher U.S. federal minimum wage: Lessons from other rich countries
But what about the effects of a sizable increase of, say, more than double the current federal $7.25-an-hour minimum wage? What would a wage floor of $15 an hour mean for low-wage workers and U.S. economic growth?
This policy brief documents big differences in the national statutory minimum wage floor across several other affluent countries compared to the United States. The analysis shows how these differences translate into very large consequences for the incidence of low pay and the buying power of low-wage workers—using a wide variety of data, including workers’ starting pay and the famous “Big Mac” index of burger prices at McDonald’s restaurants in these countries—and concludes by reporting evidence that these substantial differences in approaches to low pay across the rich world show no correspondence to standard indicators of employment performance.
In short: Neither employment nor unemployment rates reflect the vast gap between the United States and other rich countries that have all but outlawed the payment of extremely low wages by establishing legal wage floors far above the U.S. federal minimum wage.
The minimum wage landscape in affluent nations
Rich countries have taken dramatically different paths on setting a lower boundary for wages. Some, including Denmark and the Scandinavian countries, have relied on extensions of collective bargaining agreements to set legal wage floors. This obviously is not how the U.S. labor market operates, so the focus of this issue brief is on those nations with statutory national minimum wages.
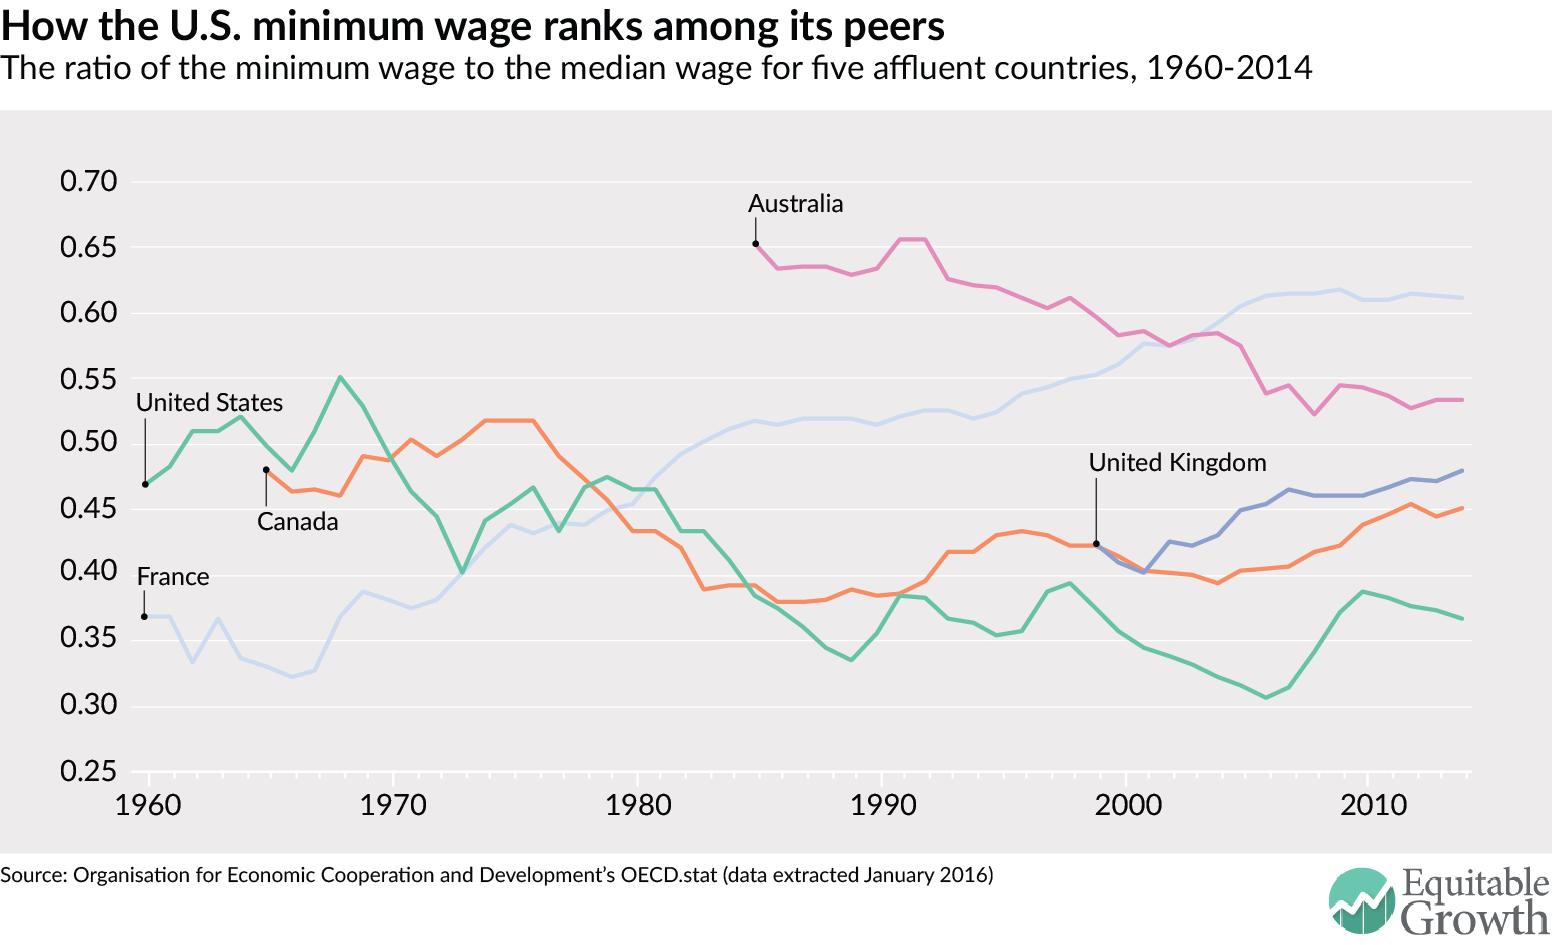
First, consider France. The French minimum wage climbed from about 35 percent of the median wage for full-time workers in the 1960s to 61 percent in 2014. In contrast, the U.S. minimum wage floor was around 50 percent of the median in the 1960s but has since fluctuated between 35 percent by the late 1980s and 37 percent in 2014. Then there is Australia, where the minimum wage also fell—from 65 percent in the early 1990s to 53 percent in 2014—but only because the country’s median wage rose faster than the statutory wage. Canada’s minimum-to-median wage rate followed about the same trajectory as the United States from the 1960s to about 1990 and has since ranged between 40 percent and 45 percent of the median wage, where it is today—well above the United States. The United Kingdom introduced a statutory minimum wage only in 1999, and as the chart shows, its value has increased relative to the median from about 40 percent in 2000 (like Canada) to 47 percent in 2014 (slightly above Canada and far above the United States). (See Figure 1.)
Figure 1
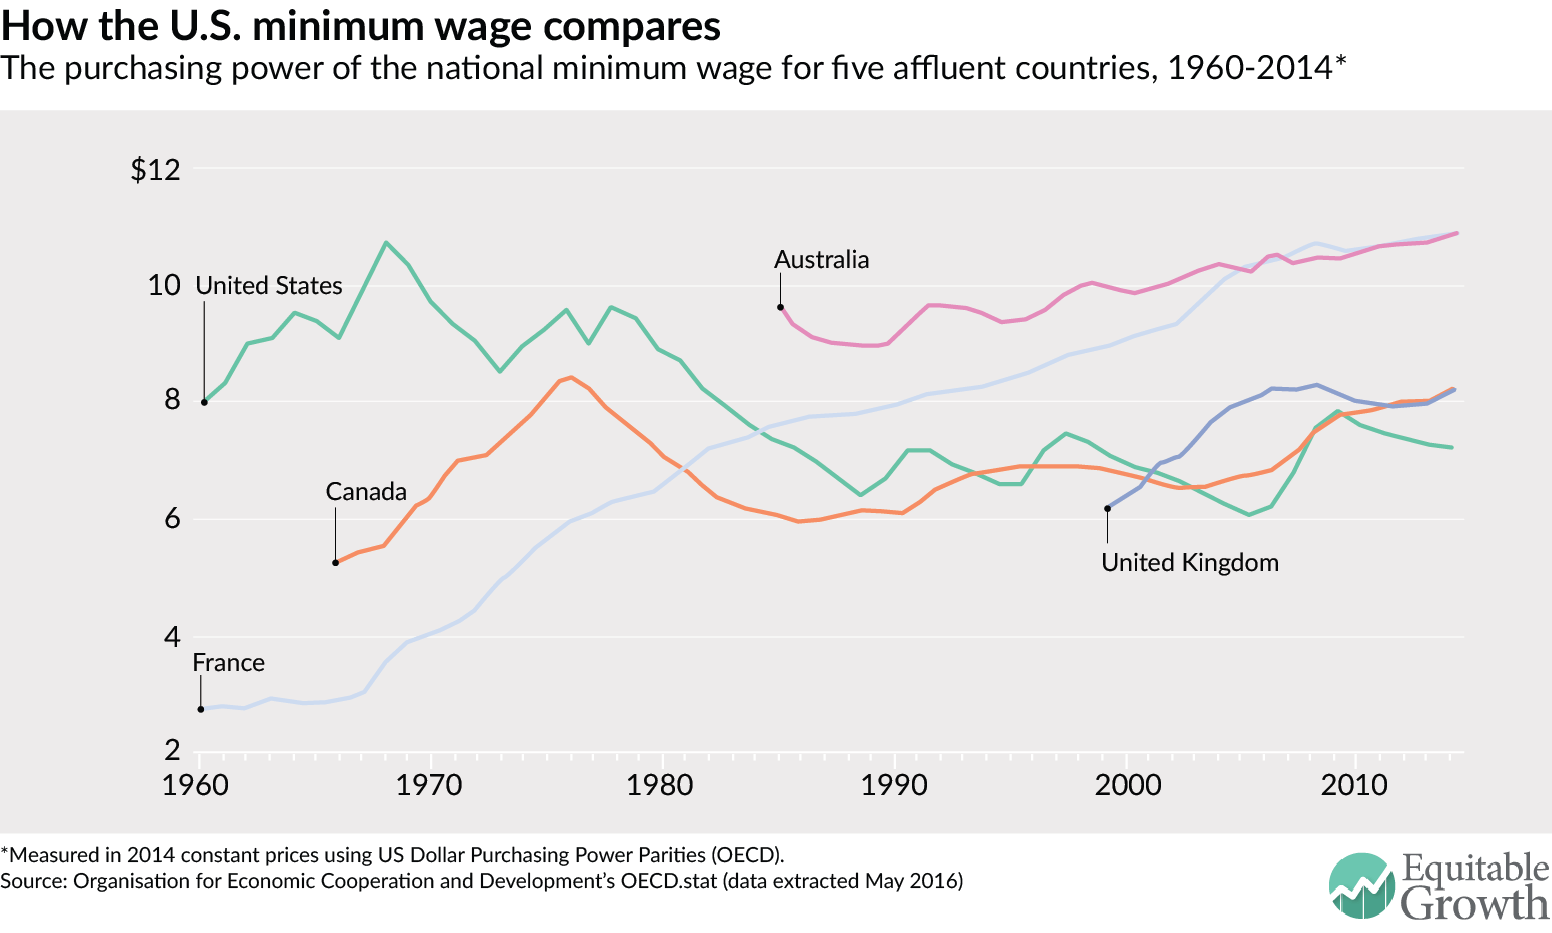
Another way to compare the minimum wage across national borders is in terms of purchasing power. The minimum wage in Australia and France buys a lot more than in the United Kingdom and Canada, and substantially more than in the United States. In Australia and France, the purchasing power of their minimum wage was equivalent to $10.90 in 2015. The wage floors in the United Kingdom and Canada are much lower—about $8.15 in 2015—but still considerably higher than the United States, where the federal minimum wage was $7.24 (below $7.25 because the figure uses 2014 constant dollars and there was slight inflation between 2014 and 2015). (See Figure 2.)
Figure 2
But the take-home pay of minimum-wage workers depends on both taxes and the effects on eligibility for benefits. A recent report on the minimum wage by the Organisation for Economic Cooperation and Development put it this way:
Without effective co-ordination, minimum wage hikes may not result in significant income gains for the targeted individuals, especially in countries where tax burdens on low-wage earners are sizeable, or where means-tested out-of-work transfers provide a comprehensive income safety net.
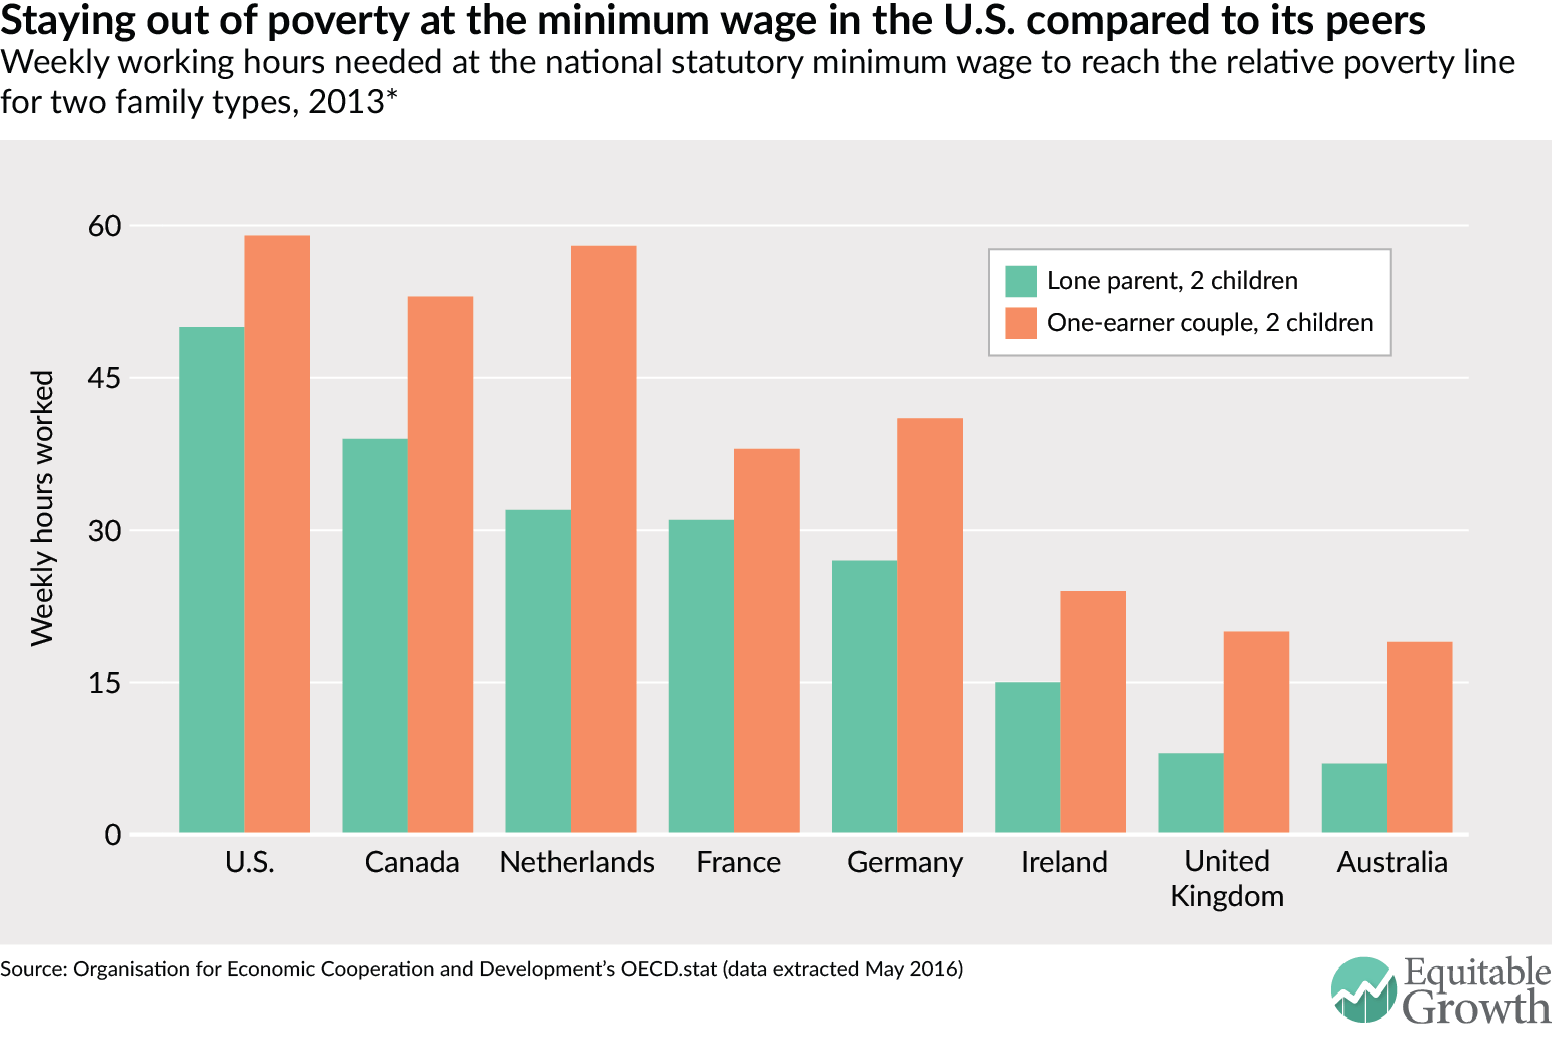
The OECD’s estimates of the weekly working hours a minimum wage worker needs to keep a family out of poverty varies enormously, from 50-to-59 hours in the United States (depending on the type of family) to 31-to-38 hours in France, to just 7-to-19 hours in Australia. Given taxes and benefits, Canada and the Netherlands are more like the United States, Ireland and the United Kingdom are more like Australia, and France and Germany fall in the middle. A one-earner couple with two children in the United States, for example, would require 59 hours of minimum wage work a week to keep that family out of poverty compared to 53 hours in Canada, 41 hours in Germany, 38 hours in France, 20 hours in the United Kingdom, and 19 hours in Australia. (See Figure 3.)
Figure 3
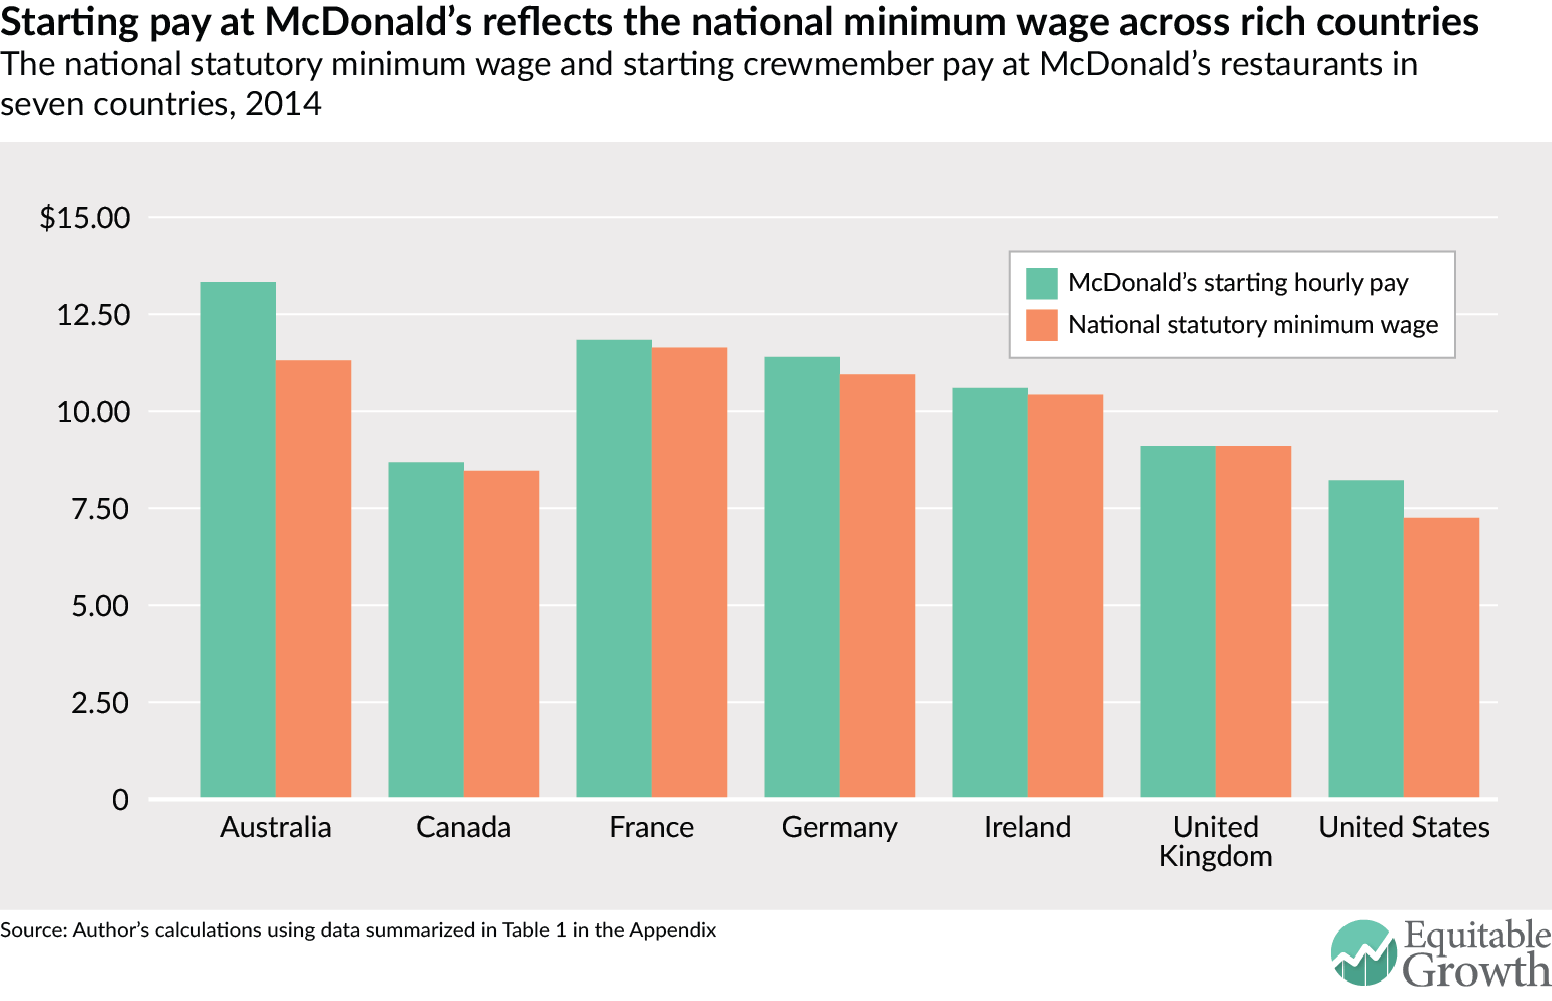
We can also get a good idea of the relative purchasing power of the minimum wage in different countries by comparing the starting wages at McDonald Restaurants, which is closely associated with the national minimum wage in each country, and by calculating the number of Big Mac burgers a minimum wage worker can buy for an hours work (at the pre-tax wage). The starting pay for a crewmember in these fast-food restaurants is, indeed, highly correlated with the nation’s minimum wage. In 2014, for example, starting pay at the restaurant chain in Australia averaged $13.33 compared to the minimum wage $11.31. This compared with $11.84 (and $11.64) in France, and just $8.22 (and $7.25) in the United States. The takeaway is that, not surprisingly, starting pay for fast food workers is far higher in countries that have a higher national minimum wage. (See Figure 4.)
Figure 4
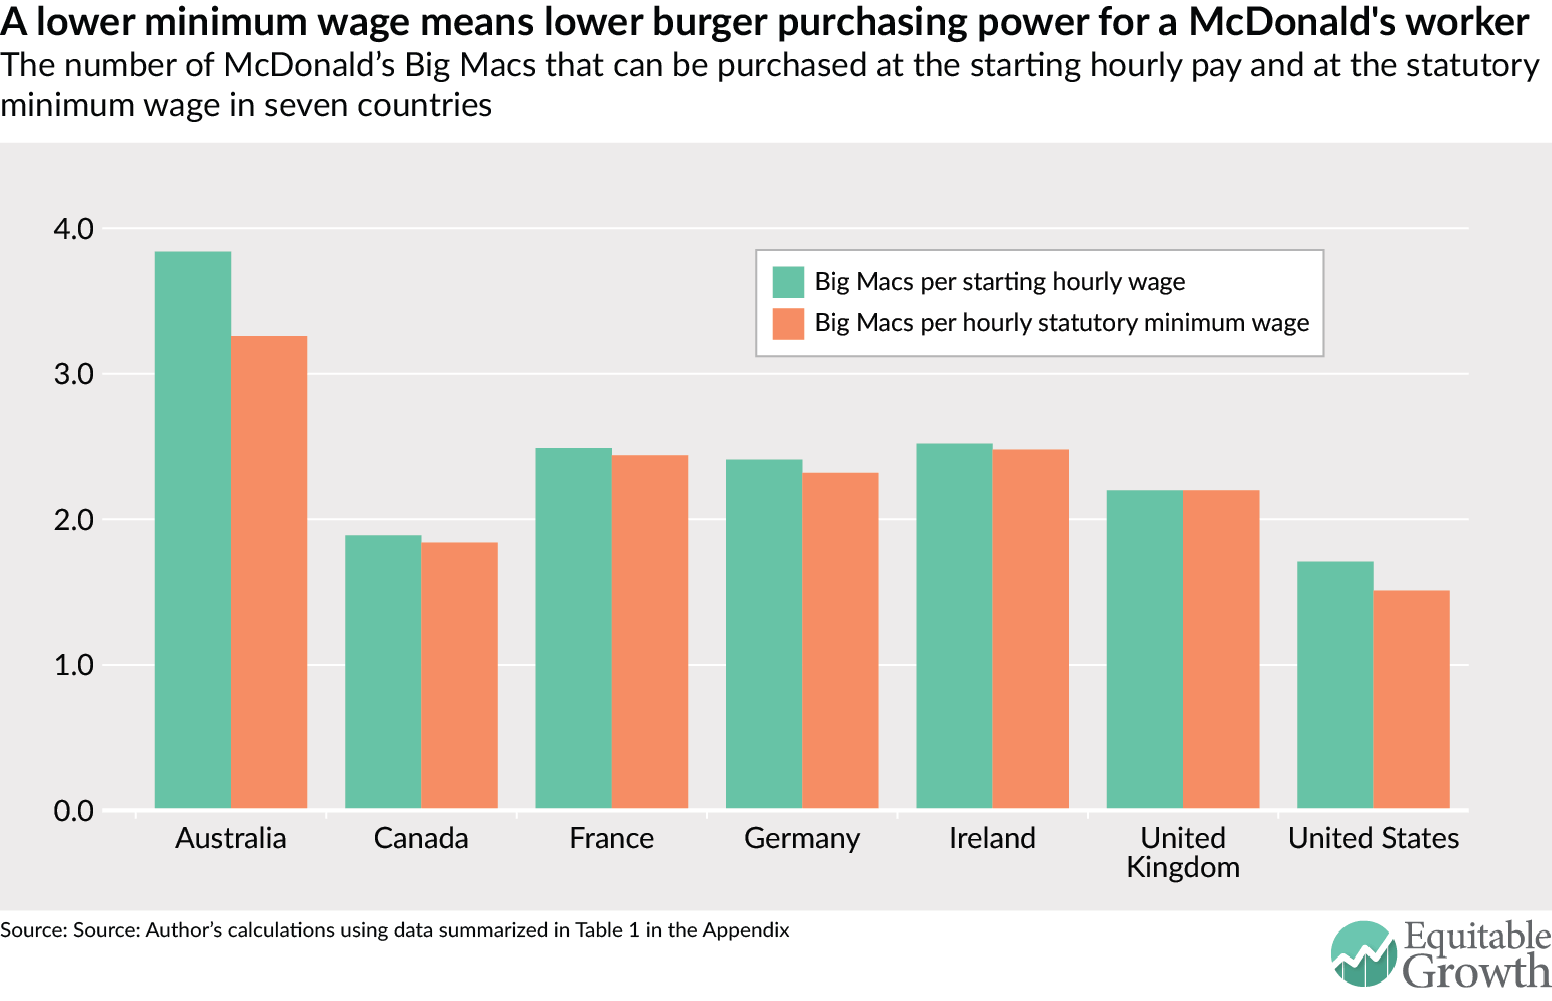
Not only is starting pay at McDonald’s extremely low in the United States compared to other rich countries, but so too is the price of a Big Mac relatively high in this country compared to other affluent countries. The combination of low pay and high prices means that the number of Big Macs a McDonald’s entry-level worker can buy is 3.8 in Australia, 2.5 in France and only 1.7 in the United States. The pattern is the same for workers’ ability to buy Big Macs at the national minimum wage: 3.3 in Australia, 2.4 in France, and 1.5 in the United States. (See Figure 5.)
Figure 5
The employment effects of the minimum wage in the United States and other affluent countries
According to conventional thinking, there are big wage-employment tradeoffs associated with a high minimum wage. As a result, while there may be some low-wage workers in Australia and France who will benefit from higher wages, many will be “priced-out” of a job. In this view, a higher minimum wage, together with higher rates of collective bargaining (among other factors) explains cross-country differences not only in the incidence of low pay, but in employment and unemployment rates for minimum wage workers.
If these so-called “labor market rigidities” price workers out of the labor market, then reducing the low-wage share of employment (via a higher minimum wage) should also reduce the low-education employment rate because young, less-educated workers should have a harder time finding and keeping jobs.
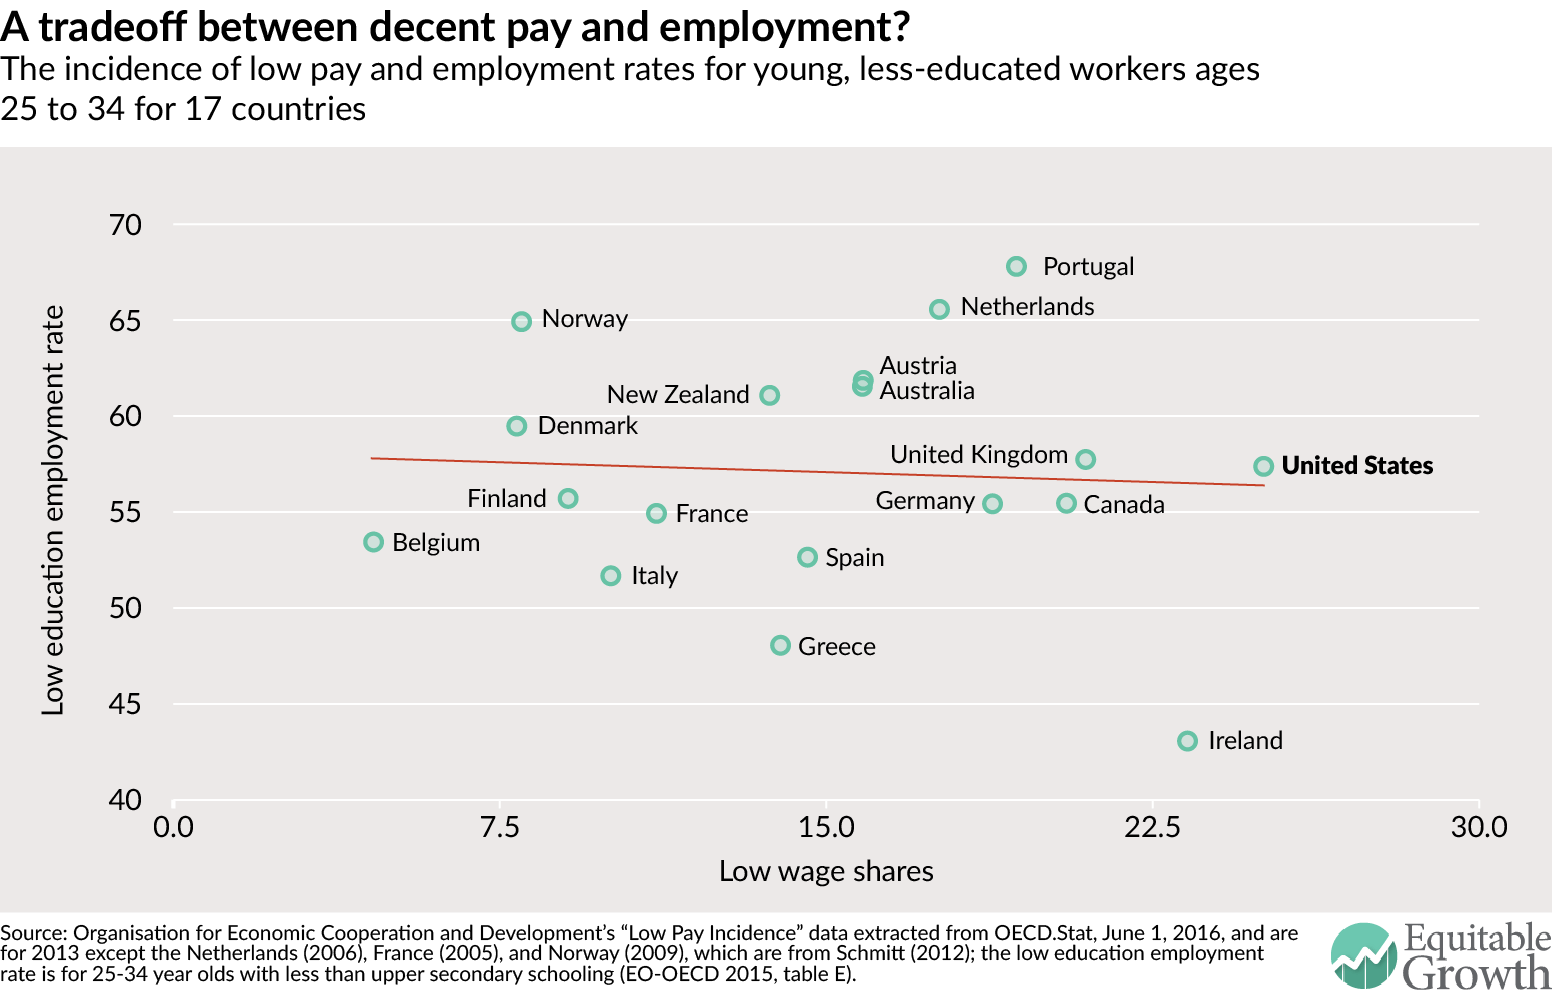
Yet the data offer little support for this orthodox tradeoff view. Rather, OECD data show that while there is a huge 14-percentage point gap in the low-wage share of employment between France (11 percent) and the United States (25 percent), the employment rates for young, less-educated workers are only moderately higher in the United States (57.4 percent compared to 54.9 percent). Similarly, Australia’s incidence of low pay is more than 10 percentage points below the U.S. level, but the low-education employment rate is more than 4 points higher, illustrating the lack of any statistical relationship across affluent countries between the incidence of low pay and the employment rate for less-educated young adults. (See Figure 6.)
Figure 6
But what about youth unemployment rates? There are two alternative unemployment rates that enable comparisons across countries. One is unemployment measured as a share of the labor force; the other is unemployment as a share of the working age population. Comparing these two measures in the United States and France and in the United States and Australia among young workers ages 15 to 24 shows no obvious correspondence between either measure and the level or trajectory of the national minimum wage.
First let’s look at the United States and France. If the conventional wisdom were correct, then United States-French youth unemployment rates should have sharply diverged. But what we see instead is considerable convergence. From 1997 to 2007 the French unemployment rate for 15-to-24 year olds fell dramatically, from 30 percent to 19.1 percent, while the U.S. rate increased from 11.3 percent to 12.8 percent, and France continued to close the unemployment gap between 2007 and 2010 (see Figure 7). This 1997-2007 convergence took place as the French minimum wage increased from 54 percent to 62 percent of the nation’s full-time median wage while U.S. federal minimum wage fell from 39 to 31 percent—exactly half the French ratio (see figures 1 and 2). Over the entire 1997-to-2014 period, the conventional French unemployment rate improved by 6.8 percentage points and the U.S. rate worsened by 2.1 points.
Figure 7
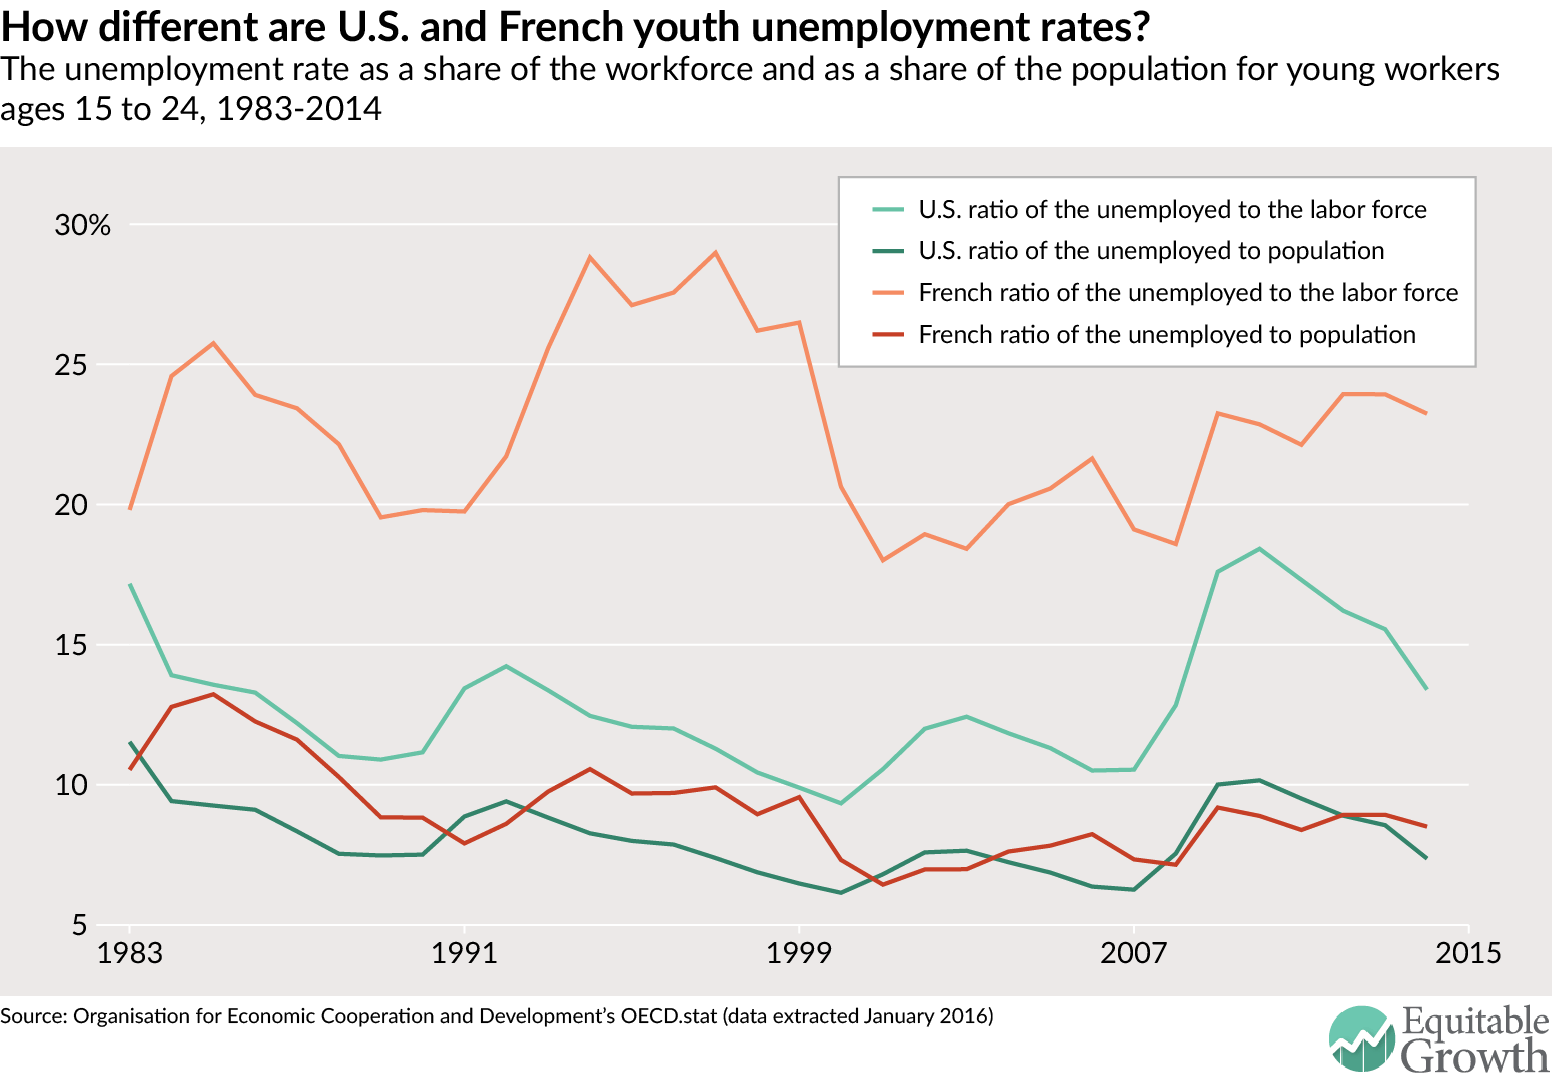
Figure 7 also compares France and the United States on a much better measure of youth unemployment: the unemployment-to-population rate. This indicator shows that these countries have tracked each other closely since 1983, with the rate in both countries fluctuating between 6 and 10 percent. In short, neither unemployment measure shows any evidence of the predicted divergence in French-U.S. employment performance.
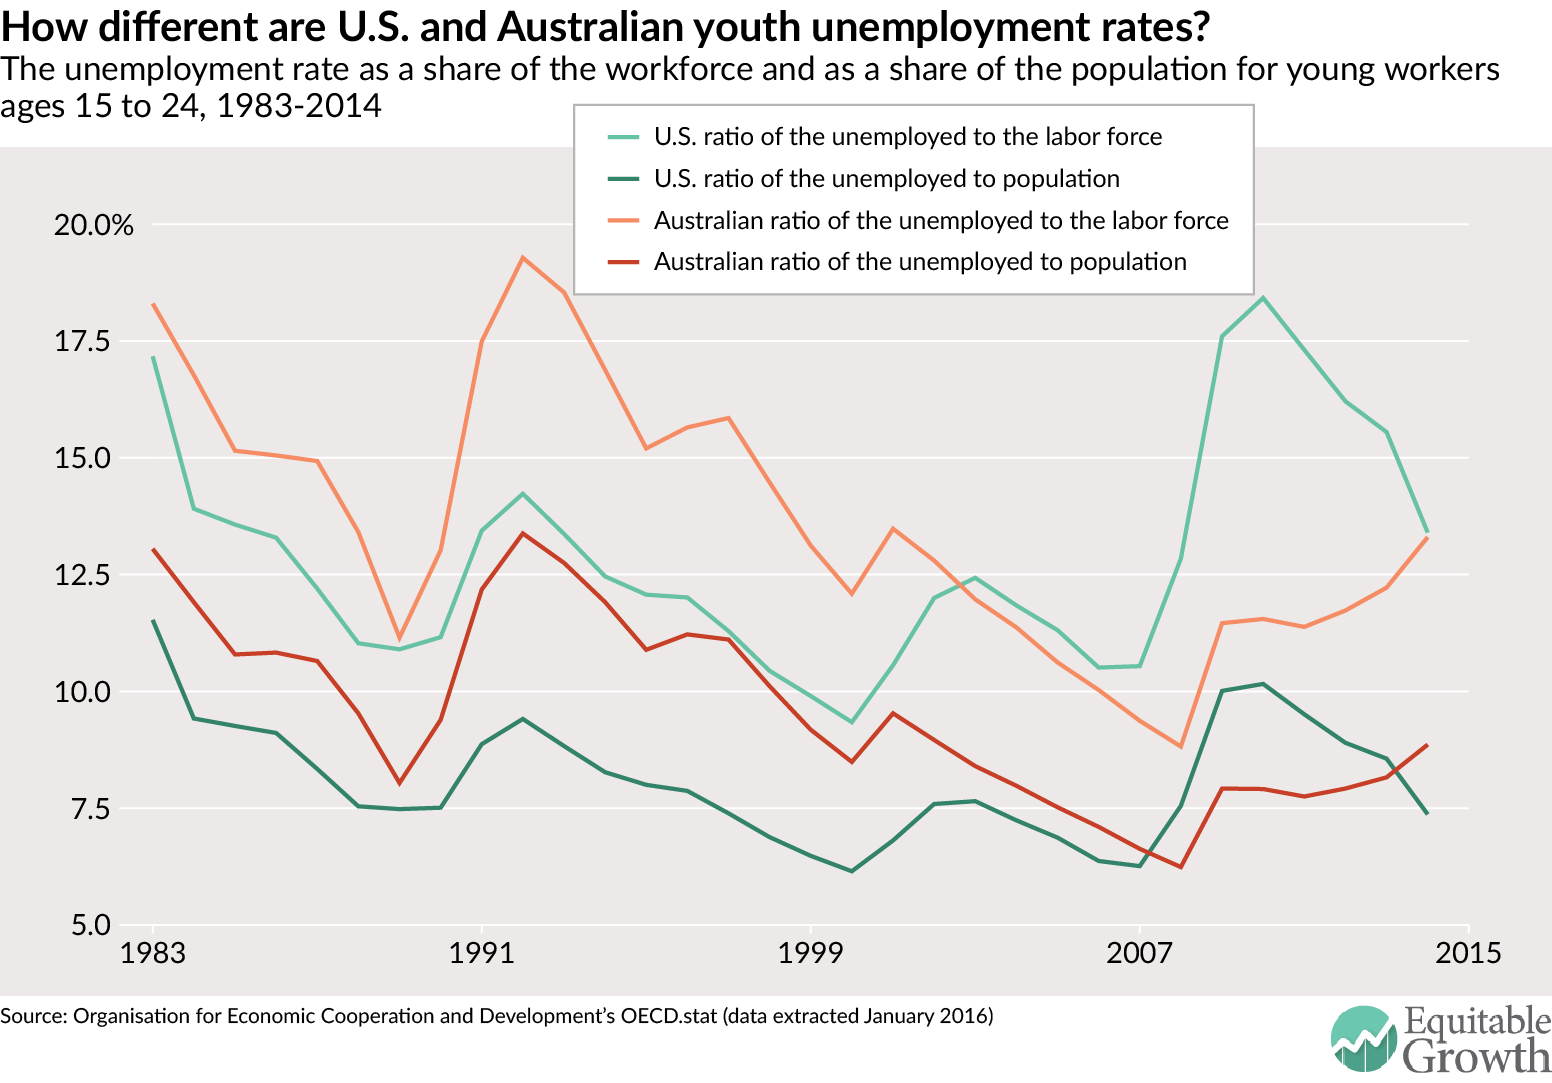
Comparing these two unemployment-rate measures for Australia and France also fails to confirm the conventional tradeoff prediction. As in France, Australia has legislated a high minimum wage by international standards. (See Figures 1 and 2.) Yet, by both indicators, youth unemployment fell sharply between the early 1990s and the global 2008-2010 economic crisis—to levels below the United States. (See Figure 8.)
Figure 8
Other affluent countries provide much higher and more universal support for working families than the United States, in the form of health care, housing, education, and child subsidies. This means the legal wage floor must carry a much higher burden for maintaining minimally decent incomes for working families than in other rich countries.
Yet, as the data presented in this policy brief demonstrates, the United States is at the extreme low-end among affluent countries on the level of the minimum wage, whether measured in terms of buying power or relative to the median wage. (See Figures 1 and 2.)
As a result, after taking into account taxes and benefits, it typically takes a minimum wage worker six to seven times as many hours of work per week to keep a lone parent or two child family out of poverty compared to the United Kingdom or Australia (50 hours versus 7 or 8 hours). (See Figure 3.)
This gigantic gap in the payoff to working at the minimum wage for U.S. workers can also be illustrated by the much lower starting pay at McDonald’s franchises, and the far fewer Big Macs a U.S. worker at McDonald’s can buy with an hour’s work than her counterparts in other rich countries. (See Figures 4 and 5.) At the same time, standard measures fail to show the predicted worsening of youth employment performance between the United States and countries that set a much higher legal wage floor, such as Australia and France. (See Figures 6, 7, and 8.)
All of this international evidence strongly suggests that, properly designed and implemented, much higher living standards are possible for working families in the United States by setting the federal minimum wage far above the current level of $7.25 without affecting overall employment opportunities for minimum-wage workers.
—David Howell is a professor of economics and public policy at The New School in New York City. This note reflects and builds on the material that appears in the Washington Center for Equitable Growth working paper, “What’s the Right Minimum Wage? Reframing the Debate from ‘No Job Loss’ to a ‘Minimum Living Wage,” co-authored with Kea Fiedler and Stephanie Luce. Special thanks to Kea Fiedler for her work on the McDonald’s data.
Photo by Remy De La Mauviniere, Associated Press