Minimum wages and the distribution of family incomes in the United States
The ability of minimum-wage policies in the United States to aid lower-income families depends on how they affect wage gains, potential job losses, and other sources of family income, including public assistance. In contrast to a large body of research on the effects of minimum wages on employment,1 there are relatively fewer studies that empirically estimate the impact of minimum wage policies on family incomes.
In my new paper, I use individual-level data between 1984 and 2013 from the Current Population Survey by the U.S. Census Bureau to provide a thorough assessment of how U.S. minimum wage policies have affected the distribution of family incomes.2 Similar to existing work, I consider how minimum wages influence the poverty rate. Going beyond most existing research, however, I also calculate the effect of the policies for each income percentile, adjusting for family size. This highlights the types of families that are helped or hurt by wage increases. I also calculate the effect on a broader measure of income that includes tax credits and noncash transfers. I quantify the offset effect of higher wages on the use of transfer programs and the gains net of the offsets by income percentiles, painting a fuller picture of how minimum-wage policies affect the U.S. income distribution and the overall well-being of U.S. families.
New Working Paper
Minimum wages and the distribution of family incomes
Overall, I find robust evidence that higher minimum wages lead to increases in incomes among families at the bottom of the income distribution and that these wages reduce the poverty rate. A 10 percent increase in the minimum wage reduces the nonelderly poverty rate by about 5 percent. At the same time, I find evidence for some substitution of government transfers with earnings, as evidenced by the somewhat smaller income increases after accounting for tax credits such as the Earned Income Tax Credit and noncash transfers such as the Supplemental Nutrition Assistance Program. The overall increase in post-tax income is about 70 percent as large as the increase in pretax income.
Effect of minimum wages on poverty
I use individual level data from the UNICON extract of the March Current Population Survey between 1984 and 2013. I focus on the nonelderly population under 65 years of age. I define family income following the official poverty measurement, using (pretax) cash income, and adjust for family size and composition using Census Bureau guidelines.3
I find that a 10 percent increase in the minimum wage reduces poverty among the nonelderly population by 2.1 percent and 5.3 percent across the range of specifications in the long run (three or more years after the policy change). There are also reductions in shares earning below 125 percent and below 75 percent of the poverty threshold. For my preferred model with the richest set of controls, the falls in shares below 75 percent, 100 percent, and 125 percent of the poverty threshold are 5.6 percent, 5.3 percent, and 3.4 percent, respectively, from a 10 percent increase in the minimum wage. (See Table 1.)
Table 1
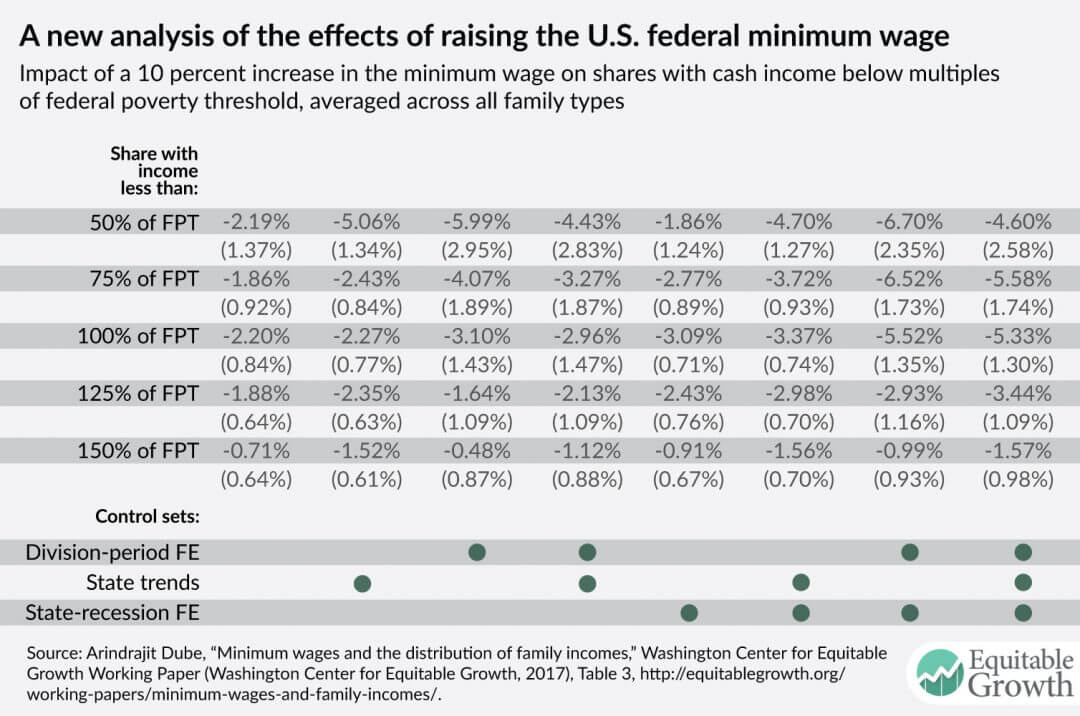
Since minimum wage policies are not randomly assigned across states, it is important to account for any bias that may arise from differences across states raising the minimum wage as compared to those which do not. For instance, there is a strong regional clustering of minimum wage policies.4 Economists disagree, however, on the best way to account for such biases. For this reason, I report results using eight different specifications with alternative controls for state-level controls that subsumes most of the approaches used in the current economics literature on minimum wages. Starting with the classic model that assumes all states are on parallel trends (known as the two-way fixed effects model), I progressively add regional controls (division-period effects), state-specific linear trends, and state-specific business cycle effects. This exercise allows the evolution of family income distribution to differ across states in many different ways.
Moreover, all of these controls have been shown to be important in the existing minimum-wage literature.5 Importantly, all of these specifications find that increases in the minimum wage reduce the nonelderly poverty rate.6 At the same time, as I show in the paper, the specification with all three sets of controls (the last column in Table 1) performs the best in a variety of falsification tests, meaning they do not spuriously suggest an effect much earlier than the policy change or suggest effects much higher up in the income distribution. This is why I consider it the preferred specification.
Effect of minimum wages on family-income distribution
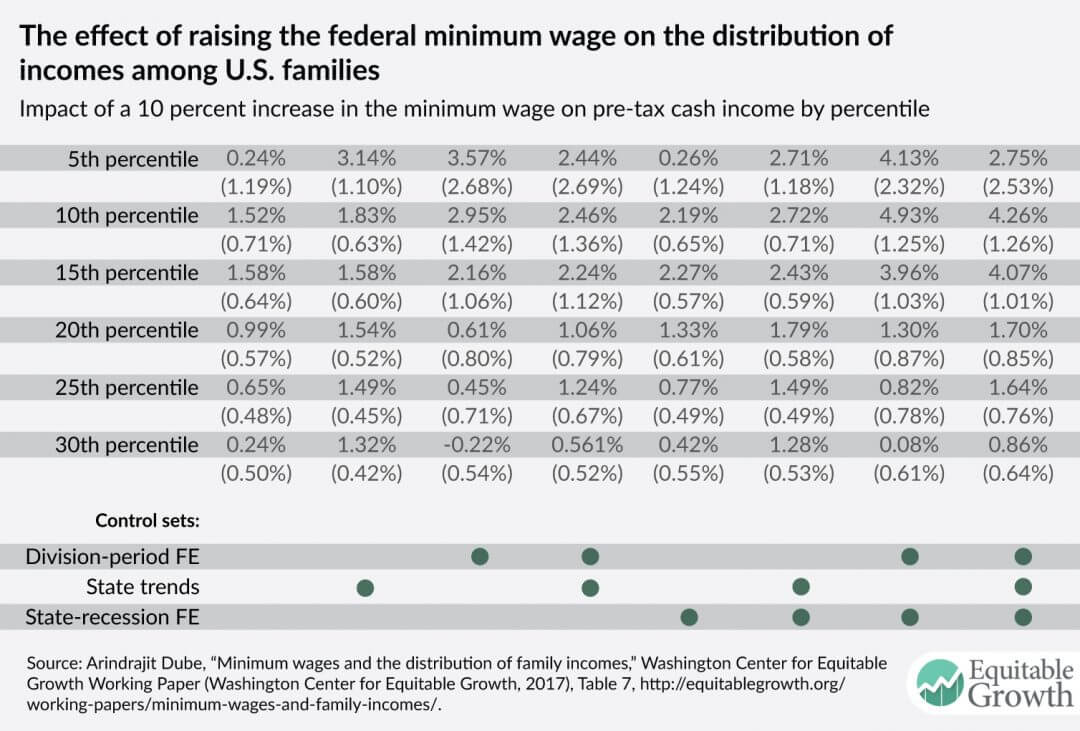
In my paper, I use the shift in the cumulative distribution of family income to calculate income changes by percentiles. I find that the largest increases occur between the bottom 10th and 15th percentiles. A 10 percent increase in the minimum wage raises pretax cash incomes in this range anywhere between 1.5 percent and 4.9 percent depending on control sets. (See Table 2.)
Table 2
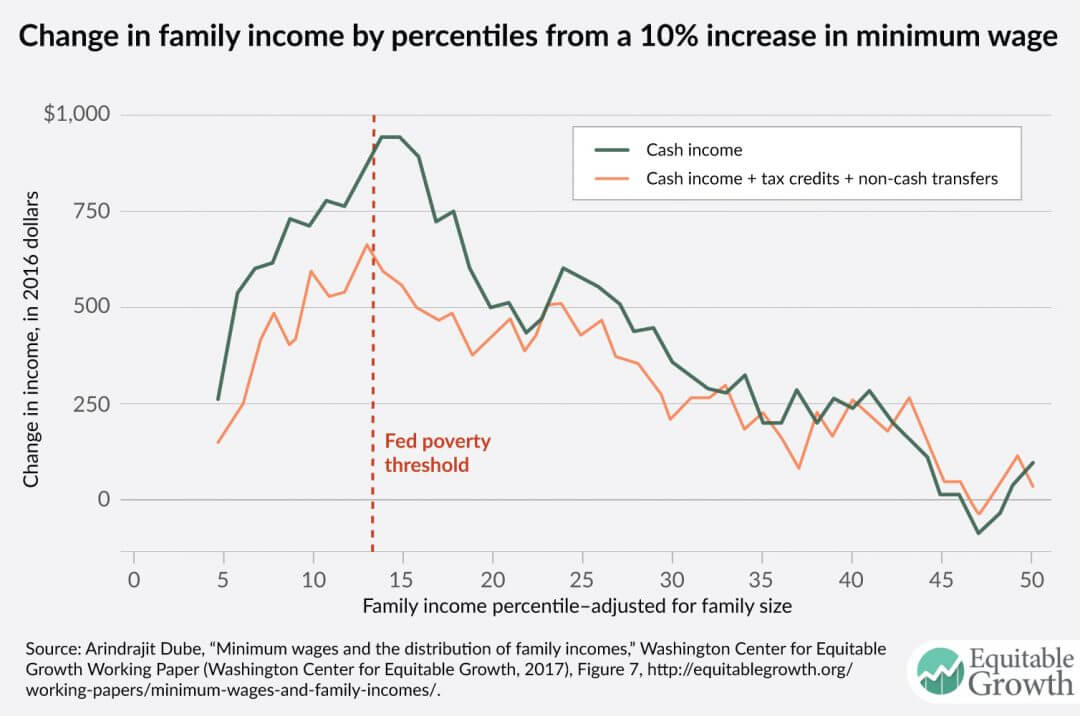
Some of the increase in pretax cash incomes among these families at or near the bottom of the income distribution is offset by reduced tax credits and noncash transfers. Losses in tax credits (such as the Earned Income Tax Credit and the Child Tax Credit) and noncash transfers (such as the Supplemental Nutrition Assistance Program) offset some of these gains. For the bottom quartile, the income gains are approximately $370 after accounting for these offsets due to reduced tax credits and noncash transfers—or around 70 percent as large as the pretax cash income gains. The offsets appear to be particularly pronounced between the 13th and 17th percentiles of the income distribution.
These findings are consistent with some individuals losing eligibility for benefits as a result of increased income. Typically, eligibility for supplemental nutrition assistance, for example, requires income to be less than 130 percent of the federal poverty threshold, which for this population binds just under the 15th percentile. On average, those in the bottom quartile of the income distribution can expect an approximately $525 increase in annual income from the minimum-wage policy; the gains are largest around the 15th percentile. (See Figure 1.)
Figure 1
Policy implications
To put the policy implications of these estimates in perspective, I calculate the impact from an increase in the federal minimum wage from the current $7.25 per hour to $12 per hour. One could use the same estimates in this paper to project the impact of alternative policies—such as raising the minimum wage to $10 per hour or $15 per hour. The caveat is that when considering inflation-adjusted minimum-wage levels much larger than those used in the study, the projections may be less reliable.
Taking into account the state minimum wages as of January 2017, an increase in the federal minimum wage to $12 (in 2017 dollars) would raise the effective minimum wage—meaning the maximum federal or state standard—by 41 percent. The long-run estimates from the paper and a 13.5 percent poverty rate among the nonelderly population in 2016 suggests a 2.45 percentage point reduction in the poverty rate from this minimum wage increase. Given the roughly 270 million nonelderly Americans in 2016, this translates into 6.6 million fewer individuals living in poverty.
We can also expect the same minimum-wage increase to raise family incomes by 14.5 percent at the 10th percentile of the family-income distribution in the long run. For the average family near the 10th percentile in 2016, this translates into an annual increase of $2,538, and after accounting for the offset due to reduced tax credits and noncash transfers, this amounts to an increase of $2,140.If we take the range of estimates from all specifications, the proposed minimum wage changes can be expected to reduce the poverty rate among the non-elderly population by 1.00 and 2.53 percentage points, hence reducing the number of non-elderly individuals living in poverty by somewhere between 2.7 and 6.8 million. For the 10th percentile of family incomes, this translates to an annual income increase ranging between 5.2 and 16.8 percent, or between $905 and $2,937. After accounting for offsets due to lost public assistance, the income increases would range between $657 and $2,790.
To put these changes in context, the Earned Income Tax Credit reduces the nonelderly poverty rate by around 1.7 percentage points, and cash transfers (means tested and nonmeans tested) reduce it by around 3.8 percentage points, while noncash transfers (other than Medicaid) reduce it by around 0.9 percentage points. In other words, a substantial increase in the minimum wage would likely have a positive impact on the nonelderly poverty rate comparable to means-tested public assistance programs.
These calculations did not factor in how minimum-wage increases may affect overall consumer prices, though such price increases are very small compared to the income gains for those in the bottom of the income distribution. The expected price increase from raising the federal minimum wage to $12 per hour would be less than 1 percent.7 Therefore, netting out any price increases does not substantially affect the real income gains for the bottom quarter of the income distribution. Price increases do mean, however, that a sizeable portion of these income gains at the bottom are likely to be borne by middle- and upper-income consumers through small increases in prices.
Conclusion
A substantial increase in the federal minimum wage can play an important role in reducing poverty and raising family incomes in the United States at the bottom of the income ladder while reducing the use of public assistance. The loss in cash and noncash transfers and tax credits among those who would benefit the most from minimum-wage increases is likely to dampen some of the benefits, especially among those around the poverty line, yet the resulting public savings could be ploughed back into further shoring up the safety net—in turn increasing the complementarity between minimum wages and income support for raising the incomes of families at the bottom of the income ladder.
—Arindrajit Dube is an associate professor of economics at the University of Massachusetts, Amherst
Download FileMinimum wages and the distribution of family incomes in the United States
End Notes
1. Dale Belman and Paul J Wolfson, “What does the minimum wage do?” (Kalamazoo, MI: WE Upjohn Institute, 2014).
2. Arindrajit Dube, “Minimum Wages and the Distribution of Family Incomes.” Washington Center for Equitable Growth Working Paper (Washington Center for Equitable Growth, 2017).
3. At the same time, I assess the validity of various specifications using a host of falsification tests, including estimating effects higher up in the income distribution, as well as analyzing leading effects (pre-existing trends) across specifications. I find that the model with all three of these control sets tends to have the best performance on falsification tests, in the sense of showing no spurious changes in the shares earning below various thresholds prior to the actual minimum-wage increase, and no spurious changes in shares earning less than three or four times the federal poverty threshold, where there are few minimum-wage workers. Therefore, the model with the full set of controls is my preferred specification, but the paper shows the key results with the full range of specifications.
4. See Sylvia A. Allegretto and others, “Credible Research De- signs for Minimum Wage Studies: A Response to Neumark, Salas and Wascher.” In Industrial & Labor Relations Review (forthcoming).
5. See Sylvia A. Allegretto and others, “Credible Research Designs for Minimum Wage Studies: A Response to Neumark, Salas and Wascher.” In Industrial & Labor Relations Review (forthcoming); Ben Zipperer, “Did the minimum wage or the Great Recession reduce low-wage employment? Comments on Clemens and Wither,” Washington Center for Equitable Growth Working Paper (Washington Center for Equitable Growth, 2016).
6. There is disagreement among economists about how best to construct the “counterfactual,” or what would have happened if minimum wages had not risen in a particular state. I use a variety of approaches, including using regional comparisons, and controls for differences in income trends and variability in how business cycles affect incomes—some of these approaches are appropriate—and show the key estimates using a wide set of models. At the same time, I find that the model with a rich set of controls tends to perform best in the sense of avoiding spurious conclusions—such as a minimum-wage increase causing a supposed impact substantially prior to the policy change or supposed effects higher up in the distribution where there are few minimum-wage workers.
7. Thomas MaCurdy, “How Effective is the Minimum Wage at Supporting the Poor?” Journal of Political Economy 123 (2) (2015): 497–545. MaCurdy calculated that the bottom quintile faced a 0.5 percent increase in prices from the 21 percent increase in the minimum wage in 1996.