Garnering economic security is complicated for young families

Overview
Over the past 40 years, women in the United States have played an increasingly important role in family economic well-being. Women have increased their levels of educational attainment and their participation in the labor force and have seen increases in pay. This transformation in how women spend their days means that most families must figure out how to make do without a full-time, stay-at-home caregiver.
While conflicts between the demands of work and caregiving are now commonplace, families too often are left on their own to cope, without the support of sufficient social infrastructure—such as affordable child care and elder care, paid time off for medical and family leave, and the flexible work hours—and macroeconomic policies that would reduce unemployment, increase wages, and encourage full employment. These findings are detailed in Heather Boushey’s recently released book, “Finding Time: The Economics of Work-Life Conflict,” which explores how women’s increased hours of work over the past four decades helped American families maintain economic security.
In this issue brief, we unpack women’s role in helping stabilize family incomes for a specific subset of the U.S. population: young families, or families where at least one person is above the age of 16 and everyone is under the age of 35. Using data from the Current Population Survey, we chronicle how family incomes changed between 1979 and 2013 for young low-income, middle-class, and professional families. Specifically, we decompose the differences in male earnings, female earnings from greater pay, female earnings from more hours worked, and other sources of income over this time period.
Download FileGarnering economic security is complicated for young families (pdf)
Read the full pdf in your browser
We find that even though women in young families have increased their hours of work as much as women in the working-age families in our issue brief “Women have made the difference for family economics security,” these young families have seen less income growth.
Here are our key findings:
- Even as women’s hours increased, declining male earnings pulled down family income in both low-income and middle-class young families. Among young low-income families, income fell by 22.9 percent over that time period, while among young middle-class families, income only grew by 3.4 percent.
- Between 1979 and 2013, women’s added hours of work boosted young families’ income across income groups. For low-income families, women’s added hours were the only growth factor. In both middle-class and professional young families, women’s higher earnings from increased pay also bolstered family incomes.
- While the work hours of women in young families increased at similar rates to the hours of women in working-age families across all three income groups, young families saw much smaller growth in women’s wages and larger losses or smaller gains in male earnings compared to working-age families.
The economic state of young workers
Despite recent improvements in the U.S. labor market, young workers continue to face tough conditions. This past March, for example, the unemployment rate for all people over the age of 16 was 5.0 percent, but was 8.4 percent for young workers (ages 20 to 24). The challenges, however, go beyond relatively high unemployment and underemployment (compared to older workers) and include slow wage growth, limited opportunities to move up the job ladder, and, for those that have not been able to find a firm foothold in the job market, the long-term scarring of their earnings potential.
Higher unemployment among younger workers is due to a number of factors, not all of which are bad. We expect that young workers will change jobs more often—ideally, transitioning between jobs to find better offers—as they build their careers and grow their earnings. To the extent that young workers’ higher unemployment is due to spending more time seeking jobs or moving to a different city, this is not necessarily bad.
But there also are not-so-good reasons for higher unemployment. Young workers are often first-time job seekers with limited work experience, which makes them more likely to be passed over in hiring decisions. Even once they are hired, they are typically the most junior employees and thus most susceptible to being laid off or let go when their firms run into trouble.
The Great Recession of 2007–2009 created a host of challenges for young workers: Those who entered the labor market at that time, couldn’t find their footing, and then were often overlooked in favor of “fresh” workers in later years. Research by economists Giuseppe Moscarini at Yale University and Fabien Postel-Vinay at University College London finds that during the Great Recession, many workers became trapped in low-wage jobs, which they describe as the job ladder “shutting down.” On top of this, for many young workers who earned a college degree, the added burden of increasing student debt loads delayed steps in the traditional economic lifecycle, among them homeownership, car ownership, and even marriage.
Economic struggles are compounded for the nearly half of young families with children. In 2013, almost half (43.7 percent) of young families had a child under age 18 present in the home. The higher up a young family is on the income ladder, the less likely they are to have a child at home. Among young professional families, only 22.6 percent have a child at home, compared to 37.7 percent among middle-class families and 57.6 percent among low-income families.
Young families struggle with how to address work-life conflict within the context of this tough labor market. As Heather Boushey documents in her book, “Finding Time: The Economics of Work-Life Conflict,” families over the past four decades have relied on the added hours and earnings of women to boost income. Women’s increased participation in the labor force has been an effective coping mechanism amid the shifting fortunes for male workers in the U.S. economy over this period, directly contributing to family economic security. But this can be a tough strategy without policies to help address the day-in, day-out conflicts between work and family life. This can be even harder for young workers who are least likely to have built up reserves of sick or vacation time or may be more vulnerable to layoffs.
This issue brief extends the analysis in “Finding Time” and explores what this looks like specifically for young families up and down the income ladder. Using data from the Current Population Survey, we calculate how family income has changed between 1979 and 2013 for low-income, middle-class, and professional families who are “young”—where at least one person is above the age of 16 and everyone in the household is 35 years old or younger. (See Box.) We decompose these changes over time into differences in male earnings, female earnings from more pay, female earnings from more hours worked, and other sources of income, which include Social Security and pensions, which are minimal given the age of workers in these families.
Between 1979 and 2013, young families saw comparatively small gains—and in the case of low-income families, large losses—in family income. When we break down the changes in household income, we find that over those 34 years, for low-income young families, the only positive contribution to income was the added earnings women received by working more hours. For young middle-class and professional families, female earnings (from both more pay and hours) have been crucial in mitigating steep drops or even smaller increases, respectively.
Defining income groups and young familiesThe analysis in this issue brief follows the same methodology presented in “Finding Time.” For ease of composition, we use the term “family” throughout the brief, even though the analysis is done at the household level. In this issue brief, we refer to what we call “young” families and compare their experiences to “working-age” families. A working-age family (the subject of an earlier issue brief) is one where at least one person in the household is between the ages of 16 and 64. Young families are a subset of these working-age families: Young families are those that have at least one person over the age of 16 and where everyone is under 35 years of age. We split households in our sample into three income groups:
Table 1 breaks down the share of young families (a subset of these working-age families) across the three income groups in 2013. Young families are more likely than working-age families to be low-income. Table 1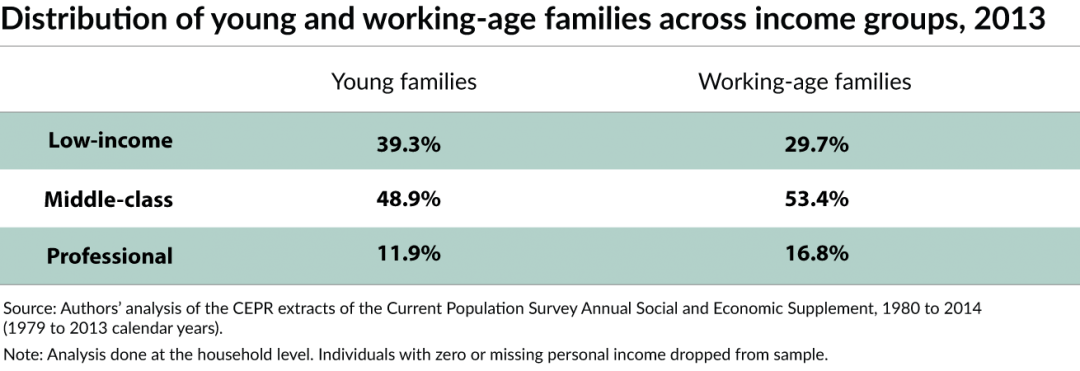
|
Setting some context
Before focusing on the changes in family income, let’s first set some broad context for the changes in family economics between 1979 and 2013.
How did income change for young families?
Between 1979 and 2013, young low-income families lost income, middle-class ones experienced small gains, and professionals saw their income soar. These trends follow those more generally for working-age families. The key difference between young and working-age families, however, is that young families’ income levels are lower than those of working-age families more generally. (See Figure 1.)
Figure 1
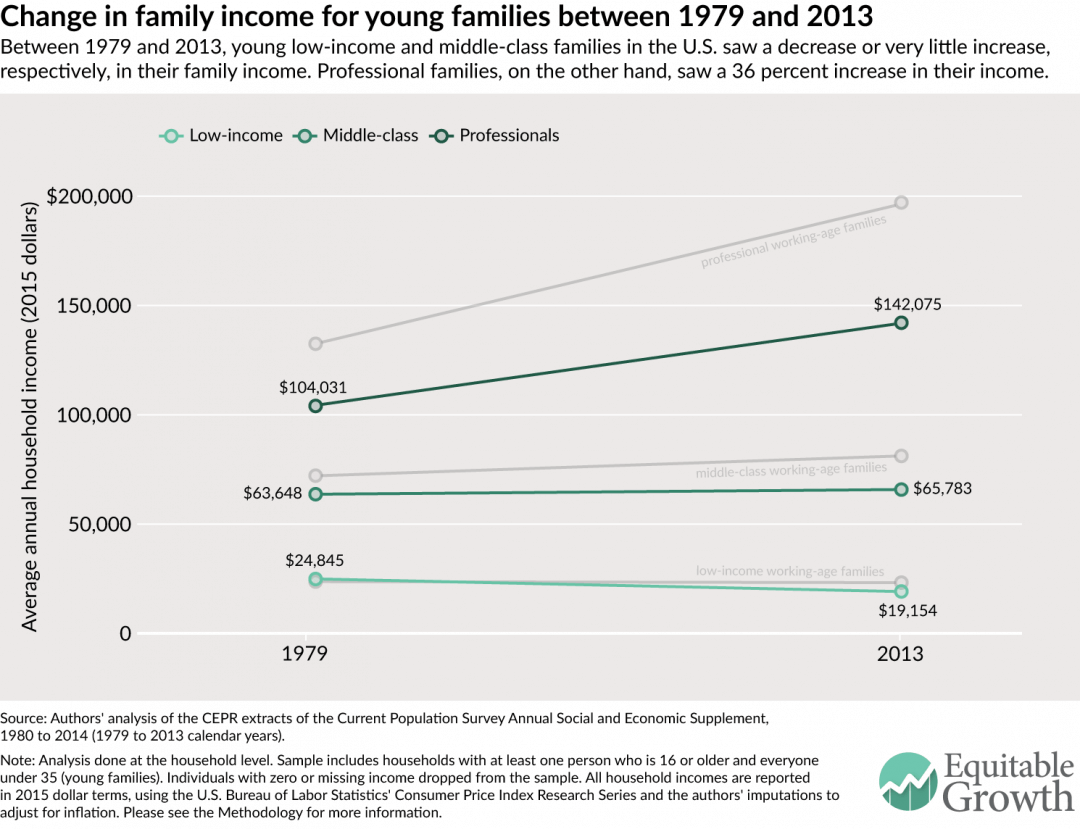
Young families have seen the same rising inequality that has affected families overall. In 1979, low-income young families had an average annual household income of $24,845 in 2015 dollars. Between 1979 and 2013, these families saw their income drop by 22.9 percent, down to $19,154. This is a significant decrease; between 1979 and 2013, low-income working-age families’ income fell only by 2.0 percent on average. Over the same time period, young middle-class families’ income stalled. In 1979, young middle-class families had an average household income of $63,648, which had grown only slightly—by 3.4 percent—to $65,783 in 2013. Young professional families, however, saw their income rise 36.6 percent, going from $104,031 in 1979 to $142,075 in 2013.
Inter-group disparities in family income are not only an indication of widening inequality but also may indicate that “filtering down” is underway. Recently, because there have not been enough jobs to employ all the young workers who need a job, those with a college degree (some of which are categorized as professionals in our analysis) have been scooping up a disproportionate share of the jobs available—even those jobs that do not require a college degree. This crowds out young workers without a college degree (most of whom fall into either our middle-class or low-income groups), making it much harder for less-educated workers to find suitable employment. Instead, they must either accept an even lower-paying job or exit the labor market completely. This might shed some light on why young low-income families have seen larger losses in income.
How did women’s working hours change in young families?
Between 1979 and 2013, across all three income groups, women in young families increased their working hours. In 1979, on average, women from young low-income households worked 662 hours annually (about 13 hours per week), and by 2013, their hours had grown by 23.0 percent to 814 (or 16 hours per week). Over this same time period, women from young middle-class families, on average, grew their annual hours by 19.8 percent, from 1,109 in 1979 to 1,328 in 2013 (or from 21 hours per week to 26 hours per week). Similarly, women in young professional families saw a 27.4 percent rise in their hours of work. (See Figure 2.)
Figure 2
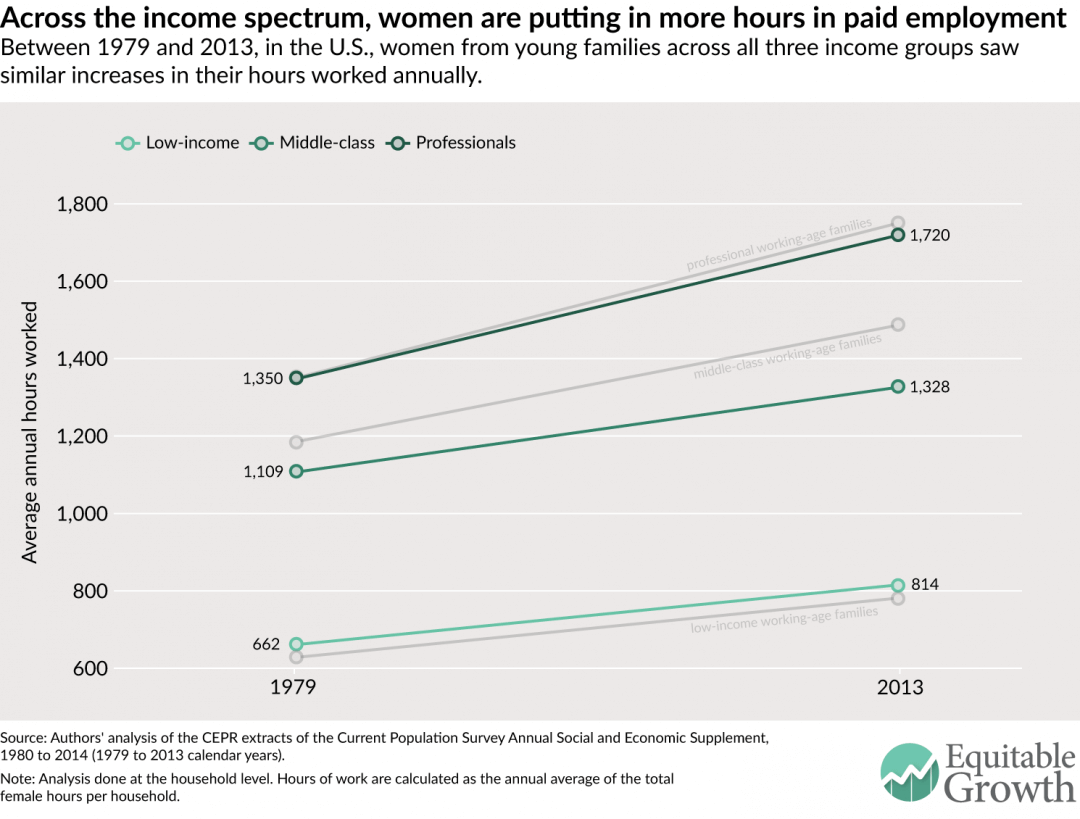
The shift in hours is virtually identical across young and working-age women in professional families, but the trends differ by age within low-income and middle-class families. In middle-class families, women in working-age families put in more hours than those in young families. This could be due to more women in young middle-class families being in school rather than working. Yet within low-income families, women in young families are slightly more likely to have a paying job than are women in working-age families, and this was true in both 1979 and 2013.
Decomposing the changes in young families’ income
Figures 1 and 2 show that between 1979 and 2013, hours of work for women in young families increased across all income groups, yet family income has not increased commensurately across all three groups. To understand what’s going on, we decompose the changes in young families’ average household income between 1979 and 2013 into male earnings, female earnings, and income from other non-employment-related sources, which include Social Security and pensions. Specifically, we divide female earnings into the portion due to women earning more per hour and the portion due to women working more per year. To calculate female earnings stemming directly from the additional hours worked, we take the difference between 2013 female earnings and the hypothetical earnings of women if they earned 2013 hourly wages but worked the same hours as women did in 1979. (For more on how we did this calculation, please see our Methodology.)
We find that within young families across the income spectrum, women’s contributions, particularly from more working hours, have been the most important factor in boosting family incomes. Yet incomes have not risen in tandem, as both men’s earnings in low-income and middle-class families pulled down family income. Without women’s added hours and higher earnings, family income would have fallen, all else being equal. (See Figure 3.)
Figure 3
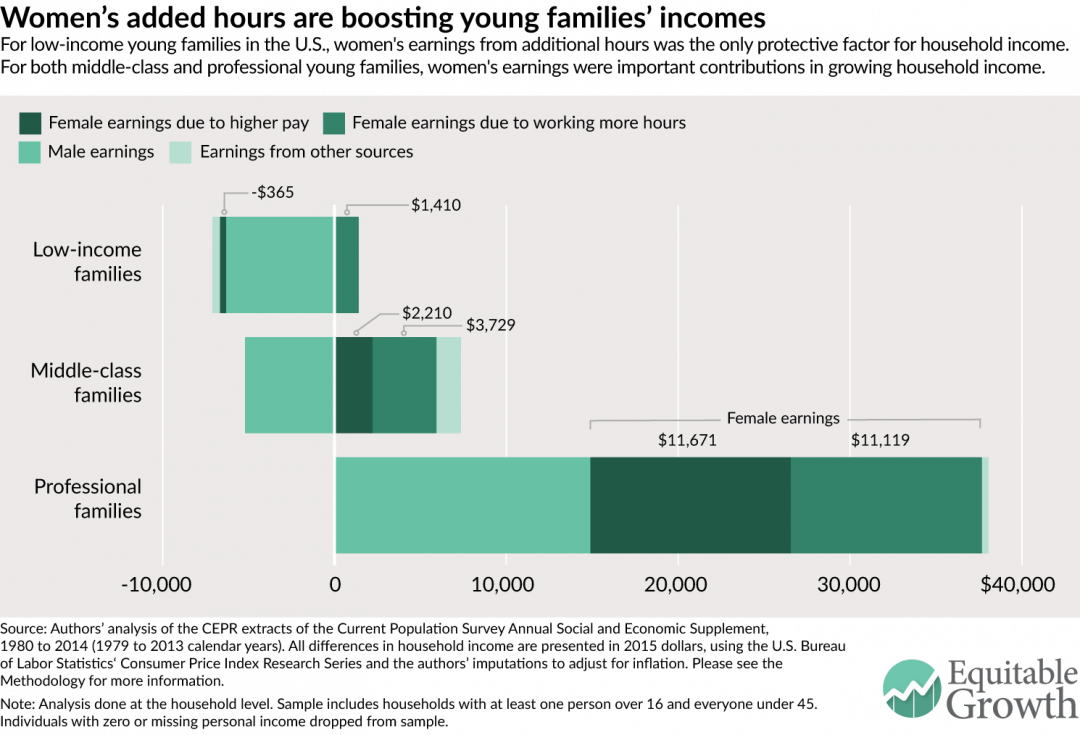
Between 1979 and 2013, young low-income families saw their income fall sharply. Most of this decline is due to the drop in men’s earnings—a loss of $6,305—although women’s earnings per hour also fell, reducing income by $365. Within young low-income families, the only positive contribution to household income was the added work hours of women, which boosted average annual income by $1,410.
Over this same period, in young middle-class families, average annual household income grew by more than $2,000, even though male earnings dragged family income down by $5,210. The only reason middle-class families saw any income gains was because of increases in women’s earnings, both in terms of higher pay per hour and more hours of work. Women’s earnings from more work hours accounted for the largest component of the gain, adding $3,729 to average annual income. The second-largest component was women’s earnings from higher pay, which added $2,210. Income from other (non-employment) sources also helped boost the incomes of young middle-class families.
Young professional families experienced significant growth in average income. Combined, women’s higher earnings from higher pay and additional hours of work boosted family income by $22,790, close to 60 percent of the total change. In stark contrast to men in young low-income or middle-class families, men in young professional families saw their earnings rise—adding $14,886 to family income. Young professional families had a relatively negligible positive change in other sources of income.
How does the experience of young families compare to working-age families?
Young families have not fared as well as working-age families more generally. When we look at the changes to family income between 1979 and 2013 for young and working-age families side by side, the challenges facing young families is put in sharp relief. Specifically, we compare the percent change in women’s hours and wages—both of which are components used in calculating women’s earnings due to more hours worked—and men’s earnings for young and working-age low-income, middle-class, and professional families. (See Figure 4.)
Figure 4
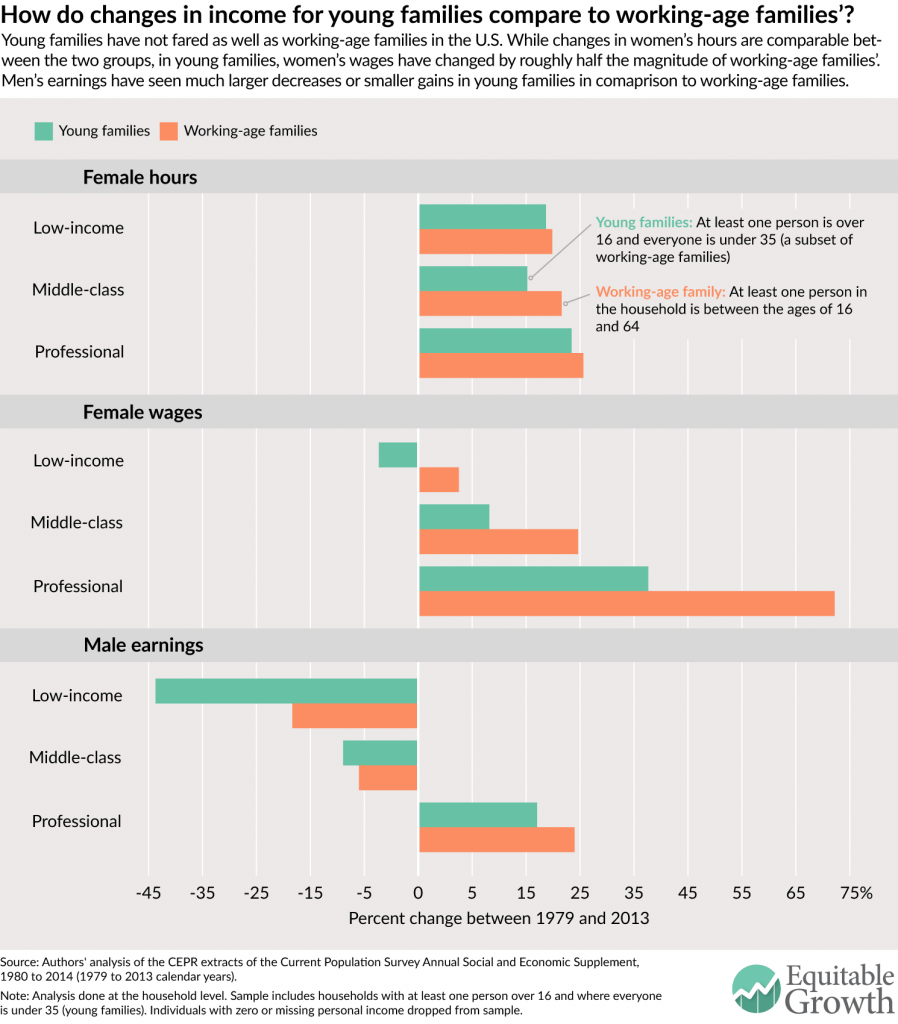
Across income groups, women from young and working-age families have seen similar rates of increase in their working hours, a fact that we saw earlier in Figure 2. But despite these similarities, the wages of women from young families did not grow nearly as much as the wages of women from working-age families. In fact, in low-income young families, women’s wages fell by 5.6 percent, compared to 8.1 percent growth in women’s wages for low-income working-age families. For the middle-class and professional income groups, young families saw much smaller gains—roughly half—in women’s wages than working-age families.
What is also striking is that across the board, men had worse earnings outcomes in young families in comparison to working-age families. At the bottom of the income ladder, men from young families saw their earnings fall by 43.8 percent, while the earnings of men from working-age families only fell by 20.4 percent. Middle-class men’s earnings for young and working-age families dropped by relatively similar percentages (11.7 percent and 9.0 percent, respectively). At the top, men from young professional families saw a 21.5 percent increase in their earnings compared to a 27.9 percent increase in men’s earnings in working-age professional families.
Conclusion
Across income groups, women’s increased work hours and—for all but low-income families—rising pay have helped young families secure their income. When we compare their changes in family income between 1979 and 2013, young families are much worse off than working-age families, seeing greater losses and smaller gains in women’s wages and men’s earnings across the board.
So while women’s earnings from both more pay and hours have made a tangible positive difference for young families, it is simply not enough to strengthen their economic security. That’s why policies that would reduce unemployment, increase wages, and encourage full employment for young workers are essential. And when the labor market is weak, ensuring that safety net programs adequately support young workers and their families is an important way to give them an equitable chance to improve their futures.
Further, with women’s added hours of work being so important to family economic well-being, the reality is that young families and working-age families alike need access to policies to help them address work-life conflicts. Nearly half of young families have a small child at home and are balancing the needs of parenting young children with holding down a job. They need access to the same basket of policies other workers need, including paid sick days, paid family and medical leave, and access to safe, affordable, and enriching child care. Many young people are also trying to navigate a work schedule with earning an educational degree, and policies such as those that promote predictable schedules can help them invest in their future while holding down a job to make ends meet.
Heather Boushey is the Executive Director and Chief Economist at the Washington Center for Equitable Growth, and the author of the book “Finding Time: The Economics of Work-Life Conflict” from Harvard University Press. Kavya Vaghul is a Research Analyst at Equitable Growth.
Acknowledgements
The authors would like to thank John Schmitt, Ben Zipperer, Dave Evans, Ed Paisley, David Hudson, and Bridget Ansel. All errors are, of course, ours alone.
Methodology
The methodology used for this issue brief is identical to that detailed in the Appendix to Heather Boushey’s “Finding Time: The Economics of Work-Life Conflict.” wanted to find out from you whether I also need to include these cutoffs. Thanks!s adequately support young workers and their fa
In this issue brief, we use the Center for Economic and Policy Research extracts of the Current Population Survey Annual Social and Economic Supplement for survey years 1980 and 2014 (calendar years 1979 and 2013). The CPS provides data on income, earnings from employment, hours, and educational attainment. All dollar values are reported in 2015 dollars, adjusted for inflation using the Consumer Price Index Research Series available from the U.S. Bureau of Labor Statistics. Because the Consumer Price Index Research Series only includes indices through 2014, we used the rate of increase between 2014 and 2015 in the Consumer Price Index for all urban consumers from the Bureau of Labor Statistics to scale up the Research Series’ 2014 index value to a reasonable 2015 index estimate. We then used this 2015 index value to adjust all results presented.
For ease of composition, throughout this brief we use the term “family,” even though the analysis is done at the household level. According to the U.S. Census Bureau, in 2014, two-thirds of households were made up of families, defined as at least one person related to the head of household by birth, marriage, or adoption.
We divide our sample into three income groups—low-income, middle-class, and professional households—using the definitions outlined in “Finding Time” and detailed in the box presented in the analysis above. For calendar year 2013, the last year for which we have data at the time of this analysis, we categorized the income groups as follows:
- Low-income households are those in the bottom third of the size-adjusted household income distribution. These households had an income below $25,440 (as compared to $25,242 and below for 2012). In 1979, 28.3 percent of all households were low-income, increasing to 29.7 percent in 2013. These percentages are slightly lower than one-third because the cut-off for low-income households is based on household income data that includes people of all ages, while our analysis is limited to households with at least one person between the ages of 16 and 64. The working-age population (ages 16 to 64) typically has higher incomes than older workers, and as a result, the working-age population has somewhat fewer households that fall into this low-income category.
- Professionals are those households that are in the top quintile of the size-adjusted household income distribution and have at least one member who holds a college degree or higher. In 2013, professional households had an income of $71,158 or higher (as compared to $70,643 or higher in 2012). In 1979, 10.2 percent of households were considered professional, and by 2013, this share had grown to 16.8 percent.
- Everyone else falls in the middle-class category. For this group, the household income ranges from $25,440 to $71,158 in 2013 (as compared to $25,242 to $70,643 in 2012); the upper threshold, however, may be higher for those households without a college graduate but with a member who has an extremely high-paying job. This explains why within the middle-income group, the share of households exceeds 50 percent: The share of middle-income households declined from 62 percent in 1979 to 53.4 percent in 2013.
Note that all cut-offs above are displayed in 2015 dollars, using the inflation-adjustment method presented earlier.
In our analysis, we limit the universe to people with non-missing, positive income of any type. This means that even if a person does not have earnings from some form of employment but does receive income from Social Security, pensions, or any other source recorded by the CPS, they are included in our analysis. Additionally, we limited our sample to young families—or households where at least one person is older than 16 and everyone is under the age of 35.
These data are decomposed into income changes between 1979 and 2013 for low-income, middle-class, and professional families. The actual household income decomposition uses a simple shift-share analysis to find the differences in earnings between 1979 and 2013 and calculate the extra earnings due to increased hours worked by women.
To do this, we first calculate the male, female, and other earnings by the three income categories. To calculate the sex-specific earnings per household, we sum the income from wages and income from self-employment for men and women, respectively. The amount for other earnings is derived by subtracting the male and female earnings from total household earnings. We average the household, male, female, and other earnings by each income group for 1979 and 2013 and take the differences between the two years to show the raw changes in earnings by each income group.
To find the change in hours, for each year, by household, we sum the total hours worked by men and women. We average these per-household male and female hours, by year, for each of the three income groups.
Finally, we calculate the counterfactual earnings of women. We use the 2013 earnings per hour for women and multiply it by the 1979 hours worked by women. Finally, we subtract these counterfactual earnings from the female earnings in 2013, arriving at the female earnings due to additional hours.
One important point to note is that because of the nature of this shift-share analysis, the averages don’t exactly tally up to the raw data. Therefore, when presenting average income, we use the sum of the decomposed parts of income. While economists typically show median income, for ease of composition and the constraints of the decomposition analysis, we show the averages so that the data are consistent across figures. Another important note is that we make no adjustments for changes over time in topcoding of income, which likely has the effect of exaggerating the increase in professional families’ income relative to the other two income groups.