Debt ≠ deficits: Why higher state and local government debt isn’t necessarily a result of higher spending

Over the past 50 years, there has been substantial growth in both public and private debt relative to U.S. gross domestic product, or GDP. The increases in federal and household debt are familiar. Less discussed is the long-term rise in state and local government debt, from less than 8 percent of GDP in the 1950s to around 18 percent today. While small relative to other sectors of the U.S. economy, this increase is not trivial. Among other things, concerns about public debt play an important role in policy debates at the state and local levels because governments perceived to have excessive debt face pressure to reduce spending.
New Working Paper
The evolution of state-local balance sheets in the US, 1953-2013
In a recently released working paper at the Washington Center for Equitable Growth, I and my co-authors Arjun Jayadev and Amanda Page-Hoongrajok use data from the U.S. Census Bureau’s Census of Governments to get a better picture of this long-term rise in state and local government debt—and of the even less discussed rise in state and local government assets. The Census Bureau data offer the most comprehensive view available on state and local government budgets and balance sheets. Our working paper is based on an accounting decomposition that explicitly incorporates all the factors contributing to changes in the debt ratio at state and local levels.
In discussions of historical changes in debt and other balance sheet variables, it is usually assumed that these changes are straightforward reflections of changes in real activity. If the debt-to-income or debt-to-GDP ratios are rising for some sector or unit, then it’s assumed that it must have been borrowing more and that it was spending more in relation to its income. The assumption that changes in debt reflect the level of borrowing, which in turn reflects spending on goods and services relative to income, is so taken for granted that it is usually not even stated. But it is not necessarily true. Debt ratios have denominators as well as numerators. And borrowing reflects a wide range of sources and uses of funds, not all of which involve real income or expenditure flows.
We know that factors other than current expenditures and income have played a central role in historical changes in debt ratios for other sectors. The behavior of U.S. federal debt relative to GDP depends at least as much on variation in interest rates relative to GDP growth rates as it does on shifts in the fiscal balance. The rise in debt-to-GDP ratios in the 1980s, in particular, is primarily due to disinflation and higher interest rates rather than anything to do with the federal budget. Conversely, the fall in debt ratios in the United States and many other countries after World War II owes more to interest rates below economic growth rates than to fiscal surpluses. And as Arjun Jayadev and I have shown in an earlier paper, the long-term rise in household debt in the United States was driven more by higher interest rates and slower income growth rates than by increased borrowing—and the deleveraging after the financial crisis was driven by higher defaults as much as by reduced borrowing.
In the new paper, we look at the full range of factors influencing state and local balance sheets. Our basic approach is a variance decomposition, in which we break down variations in debt growth across time and between states into all the factors that contribute to it—revenues and expenditures but also nominal income growth (which affects the denominator of the debt ratio) and net accumulation of financial assets, including contributions to pension funds. This last factor is not important for the federal government because pension contributions for public employees make up a small and stable fraction of federal spending, and the federal government does not hold significant financial assets outside of trust funds. But for state and local governments, both pension contributions and additions to directly held financial assets play important roles in the evolution of their finances over time.
We look first at variation over time—at what makes the difference between years in which aggregate state and local debt is rising, stable, or falling as a share of GDP. The key results of our paper show the share of the variance in annual debt ratio growth accounted for by each of the variables shown. (See Table 1.)
Table 1
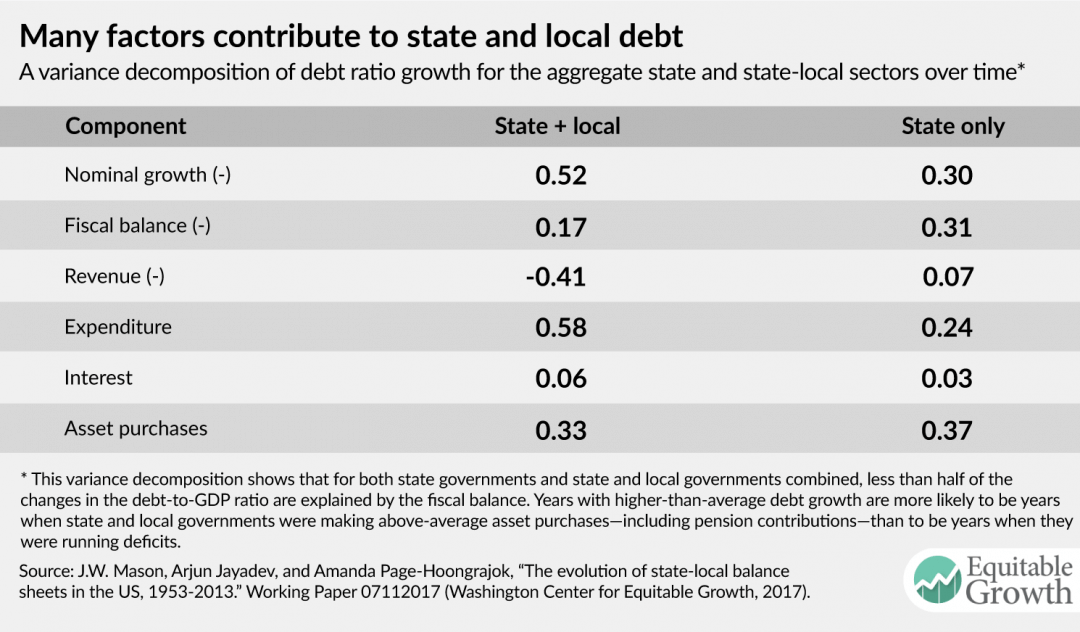
We find that for the state and local sector as a whole, the most important source of variation in debt ratio growth is nominal income growth—that is, real growth plus inflation. Fifty-two percent of the variance in annual debt ratio changes is explained by the ratio’s denominator, rather than its numerator. The next most important factor is the pace of asset accumulation, explaining 33 percent of variation in debt ratio growth. Only 17 percent of variation in state and local debt ratio changes is attributable to fiscal surpluses and deficits. For state governments alone, the fiscal balance accounts for 31 percent of variance in debt ratio growth.
Despite legal balanced-budget requirements, state (though not local) governments do sometimes see significant fiscal deficits. But these are mainly financed on the asset side, not by increased borrowing. This was very clear during the Great Recession period: Between 2007 and 2010, state budgets moved from modest surpluses to deficits—reaching an aggregate deficit of 0.5 percent of GDP in 2009—while debt ratios rose significantly. Yet surprisingly, there was no direct connection between these two developments; deficits were accommodated entirely by reduced asset accumulation, with no increase in credit-market borrowing. Meanwhile, the rise in debt ratios was fully explained by the fall in nominal income.
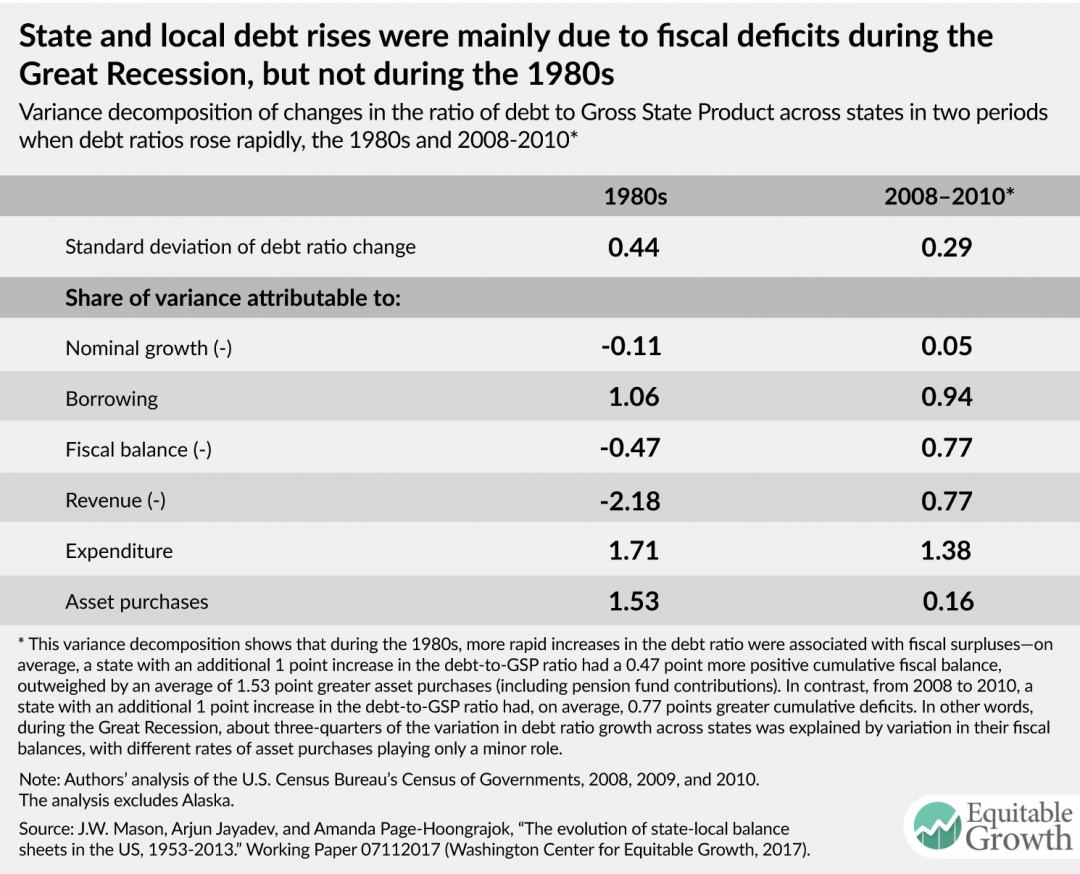
When we turn to variations in debt growth across states, rather than over time, borrowing matters more and nominal income growth matters less because in the postwar United States, most variations in nominal income growth are shared across states. But the states that borrow more are not necessarily the ones with higher deficits. During the period of rapidly rising state debt during the 1980s, for example, more than all of the variation in debt ratio growth is explained by asset accumulation. In other words, states that increased debt more during the 1980s were actually the ones with above-average surpluses; they nonetheless borrowed more because their pension fund contributions and other asset purchases were even larger than their surpluses. So during the 1980s, the difference between states with big rises in debt ratios and those with stable or falling ratios is entirely due to the former adding assets more rapidly.
In contrast, during the 2000s, variations in state debt ratio growth are mainly accounted for by variation in state fiscal balances, just as the conventional view assumes. But it’s important to add that variations in borrowing across states are due to variation in revenues rather than in expenditures. In fact, during the Great Recession period, the states with more rapid debt growth actually had lower state spending as a share of state domestic product than the states with less debt growth. (See Table 2.)
Table 2
So what do we take from this? Why does it matter?
First, the paper offers a warning against simple morality-tale interpretations of state and municipal finances. Rising state and local debt is not a sign of fiscal profligacy. Whether we look at variations over time or across states, there is no reliable relationship between changes in the debt ratio and public spending.
Second and more broadly, it’s a warning against presuming that leverage or balance sheets reflect real activity. It’s easy to assume that rising debt equals higher borrowing equals more spending. But historically, this is often not the case. For state and local governments, as for other sectors, the evolution of balance sheet positions owes as much to purely financial and monetary factors as to shifts in real activity.
Third, we should pay more attention to the role of inflation in changes in debt ratios. During the decade of 1955 to 1964, the state and local debt ratio rose at an average of 0.4 percentage points per year. During the following 15 years, it fell at a bit over 0.1 percentage point per year. Yet borrowing was no lower in the second period than in the first. The difference between rising and stable debt ratios was entirely because inflation was higher in the late 1960s and 1970s than it was in the 1950s and early 1960s.
This should be a consideration in discussions of monetary policy. Since 2008, inflation has fallen short of the Federal Reserve Board’s 2 percent inflation target by a cumulative 4 percentage points. This has increased public and private debt ratios, just as higher deficits would have done. In the case of state and local governments, this lower inflation is the equivalent of $150 billion in additional spending. So to the extent that debt imposes constraints—real or perceived—on the budgets of these governments, this below-target inflation translates into less money for teachers, roads, firefighters, and other public services. To avoid raising the real burden of debt, the Fed needs to overshoot its target by as much as it undershoots it.
Fourth, for state and local governments in particular, we need to pay attention to assets as well as liabilities. Over the past 50 years, state and local government assets—both in pension funds and directly held—have grown more than twice as much as debt. If we consolidate pension funds with the sponsoring governments, the state and local sector is now a substantial net creditor in financial markets, as is every individual state. Even with pensions and other trust funds excluded, the state and local sector as a whole and most individual states still own financial assets in excess of their debt.
These large asset positions among state and local governments are one important reason why we shouldn’t assume that more credit-market borrowing equals less saving. A sector or unit that is adding to its asset position can increase borrowing and increase saving simultaneously, and this has often been the case for state and local governments.
—J.W. Mason is an assistant professor of economics at John Jay College, City University of New York, and a fellow at the Roosevelt Institute.