Seven important U.S. economic trends to consider before President Trump’s first address to Congress

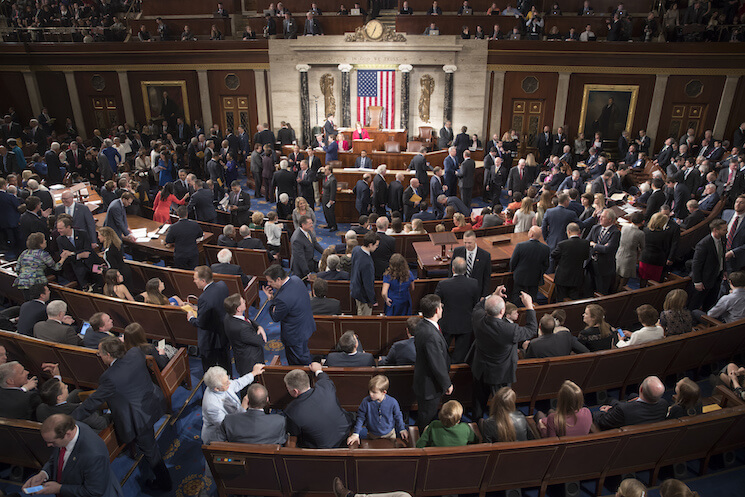
Tonight, President Trump will address a joint session of the U.S. House of Representatives and U.S. Senate. The speech will very likely focus on the economy, so Equitable Growth has compiled seven useful graphs that show important trends in the U.S. economy. The graphs show the state of the ongoing recovery from the Great Recession of 2007-2009 as well as some remaining structural challenges facing the economy. Underlying all of these graphs is the need for an accurate read of economy developments in order to inform sound policymaking. This cannot be done without accurate, unbiased data.
Perhaps the starkest trend in the United States in recent decades is increasing income inequality. The latest published data gives policymakers the best look yet at levels of income inequality, and confirms the high levels other studies have shown. (See Figure 1.)
Figure 1

One consequence of higher levels of income inequality in the United States is that it’s harder for children to earn more than their parents did at the same age. Absolute income mobility appears to have been declining since the 1980s. (See Figure 2.)
Figure 2

Some measures of underemployment—such as the U6 rate that includes the number of workers either discouraged from looking for a job or working part time but eager for full-time work—continue to show that slack remains in the U.S. labor market. But the overall underemployment trend since the Great Recession has been similar to the headline unemployment rate: downward. (See Figure 3.)
Figure 3

Another measure of the health of the U.S. labor market—the number of unemployed workers per job opening—has returned to pre-recession levels. The lower this number goes, the more employers need to actively recruit workers to get them to take jobs. (See Figure 4.)
Figure 4

The share of prime-age workers with a job remains below its pre-Great Recession peak in December 2007. But note that the employment rate was below its 2001 peak before the onset of that deep recession, suggesting a possible structural reason for this decline. The lack of strong wage growth indicates there are structural problems related to a lack of demand. (See Figure 5.)
Figure 5

Another structural trend in the U.S. labor market is the declining labor force participation rate for women. Declining participation for men and possible reasons for this decline—among them technological change, trade, or macroeconomic policy choices—have garnered quite a bit of attention, but the United States is now falling behind other high-income countries when it comes to female participation in the labor market. The likely reason is the lack of policy support for women who choose to work. (See Figure 6.)
Figure 6

Meanwhile, U.S. corporate profits have become an increasingly larger part of the US economy. The source of this increase in corporate profits is not entirely clear yet, but the research points toward increasing business concentration possibly due to a lack of antitrust enforcement, increased outsourcing, or technological change. (See Figure 7.)
Figure 7

Conclusion
The policies outlined by President Trump and debated in Congress will have implications for the economy as a whole, and for individuals in all communities across the United States. The trends detailed in this factsheet are important markers for policymakers committed to an economy that works for all.
Additional resources
“The fading American dream: trends in absolute income mobility since 1940,” Raj Chetty, David Grusky, Maximilian Hell, Nathaniel Hendren, Robert Manduca, and Jimmy Narang.
“Economic growth in the United States: A tale of two countries,” Thomas Piketty, Emmanuel Saez, and Gabriel Zucman.
“Can women’s ‘sagging middle’ help explain the fall in U.S. labor force participation rates?,” Elisabeth Jacobs.
“U.S. tax revenue will rise modestly in the next 10 years, not thanks to corporate taxes,” Kavya Vaghul.
