JOLTS Day Graphs: July 2017 Report Edition
Every month the U.S. Bureau of Labor Statistics releases data on hiring, firing, and other labor market flows from the Job Openings and Labor Turnover Survey, better known as JOLTS. Today, the BLS released the latest data for July 2017. This report doesn’t get as much attention as the monthly Employment Situation Report, but it contains useful information about the state of the U.S. labor market. Below are a few key graphs using data from the report.
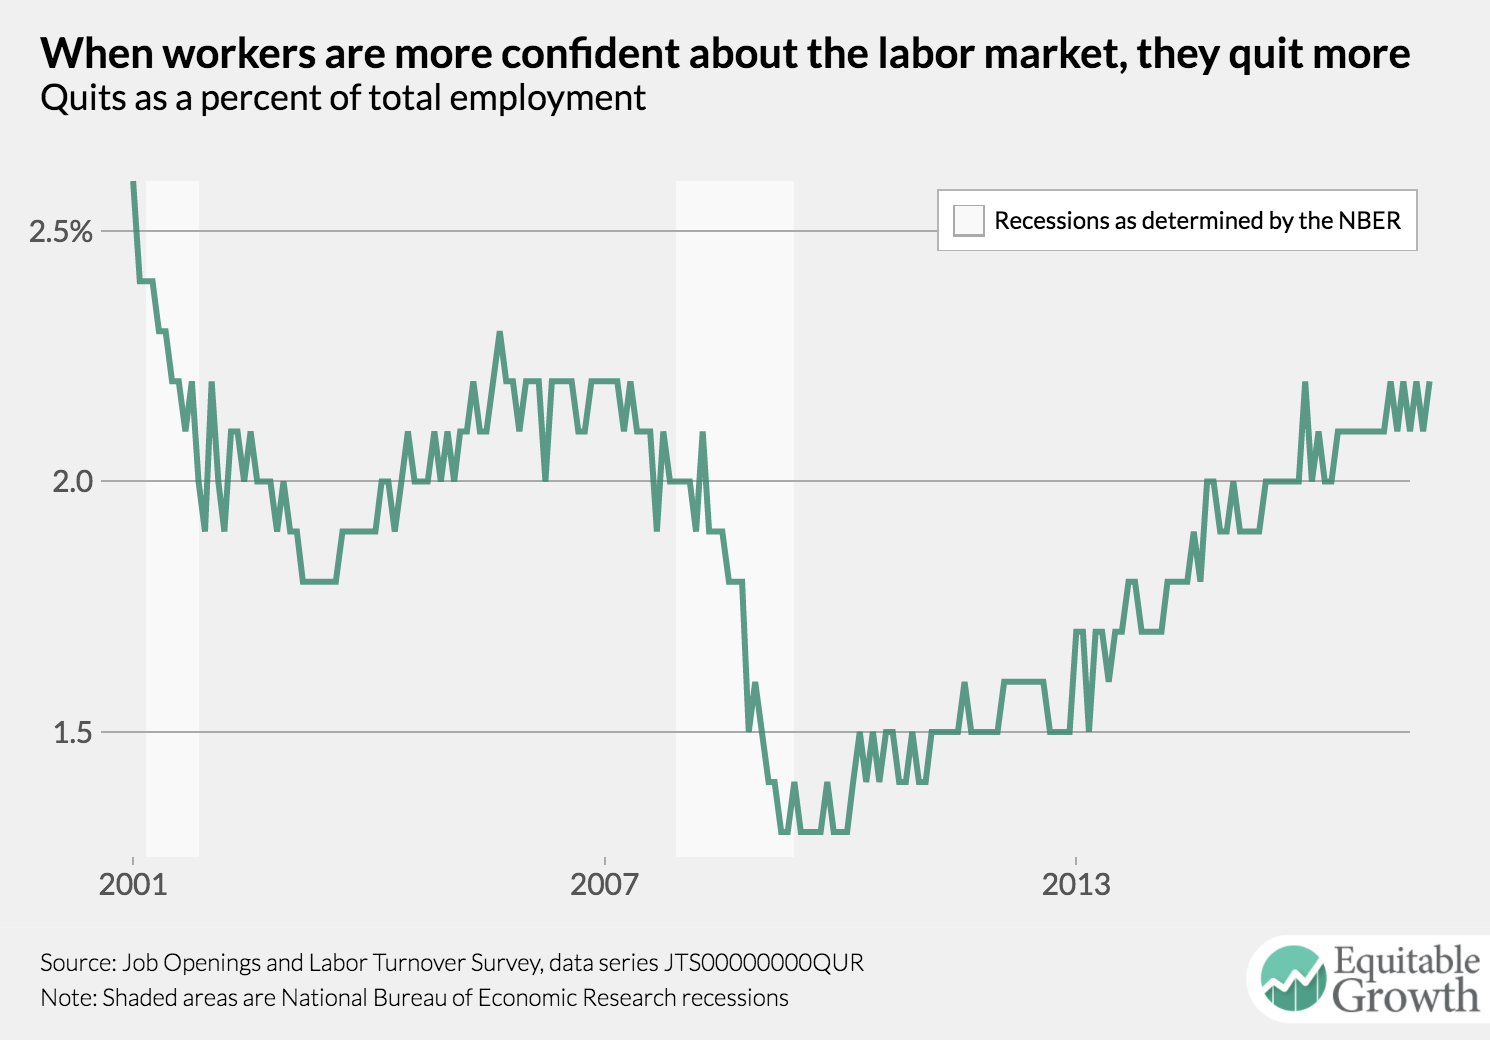
The quits rate moved up slightly to 2.2 percent in July. But it remains locked in the same range it’s been in since the beginning of the year.
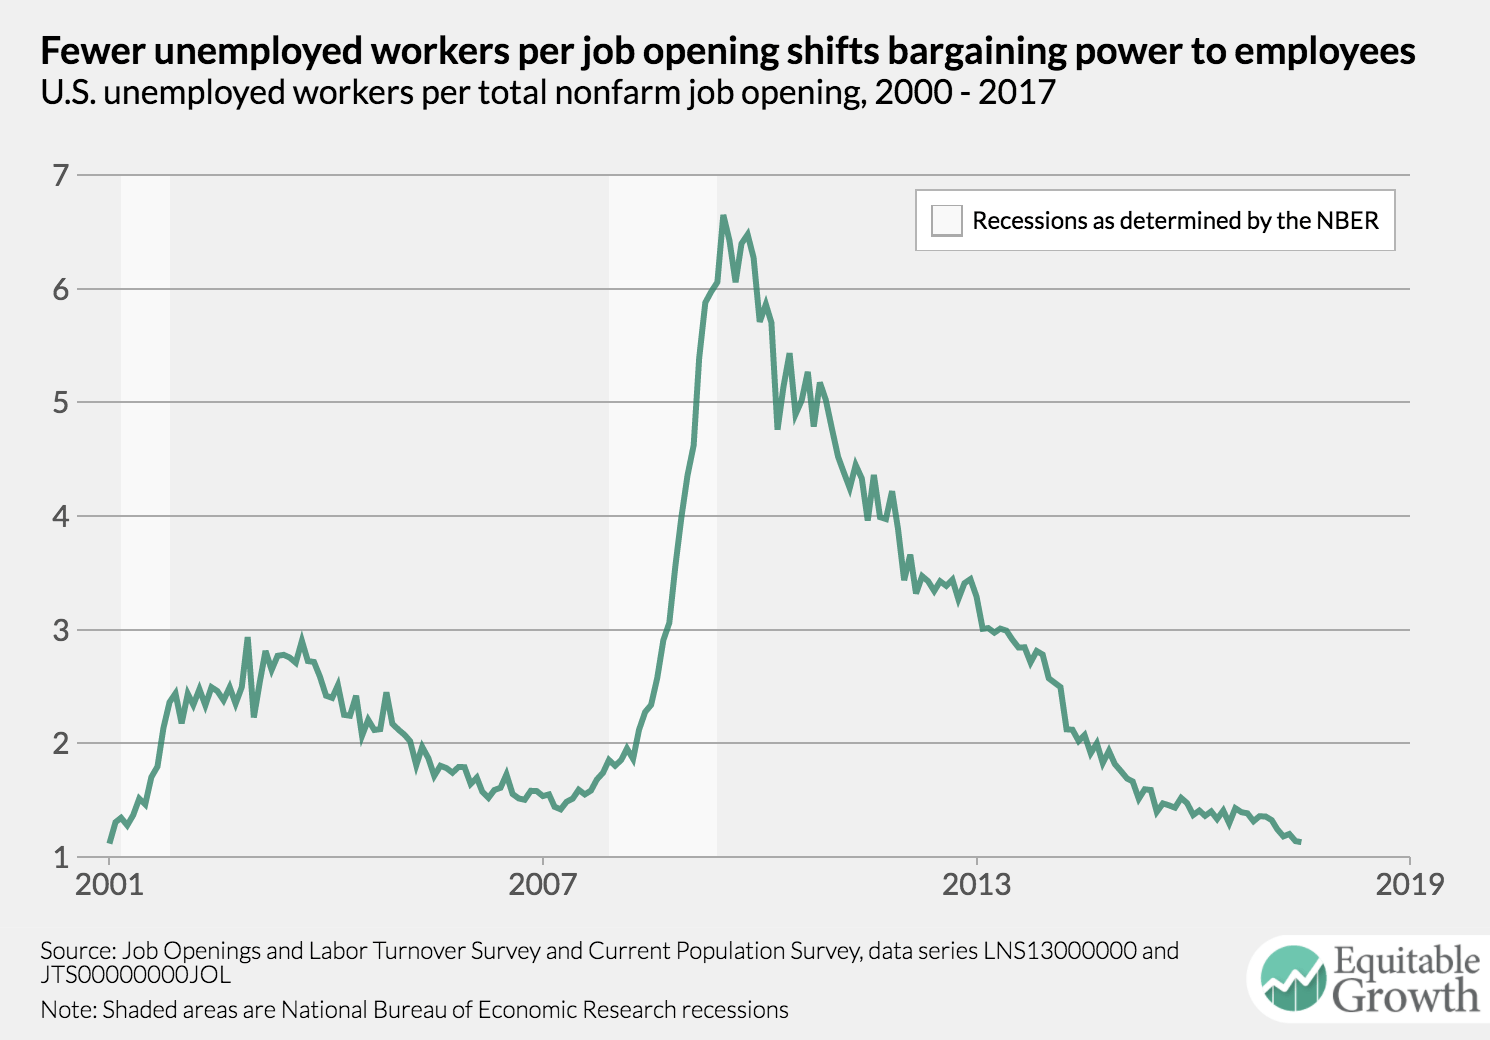
The ratio of unemployed workers to job openings declined in July and is now at its second-lowest recorded level: 1.13 workers per vacancy.
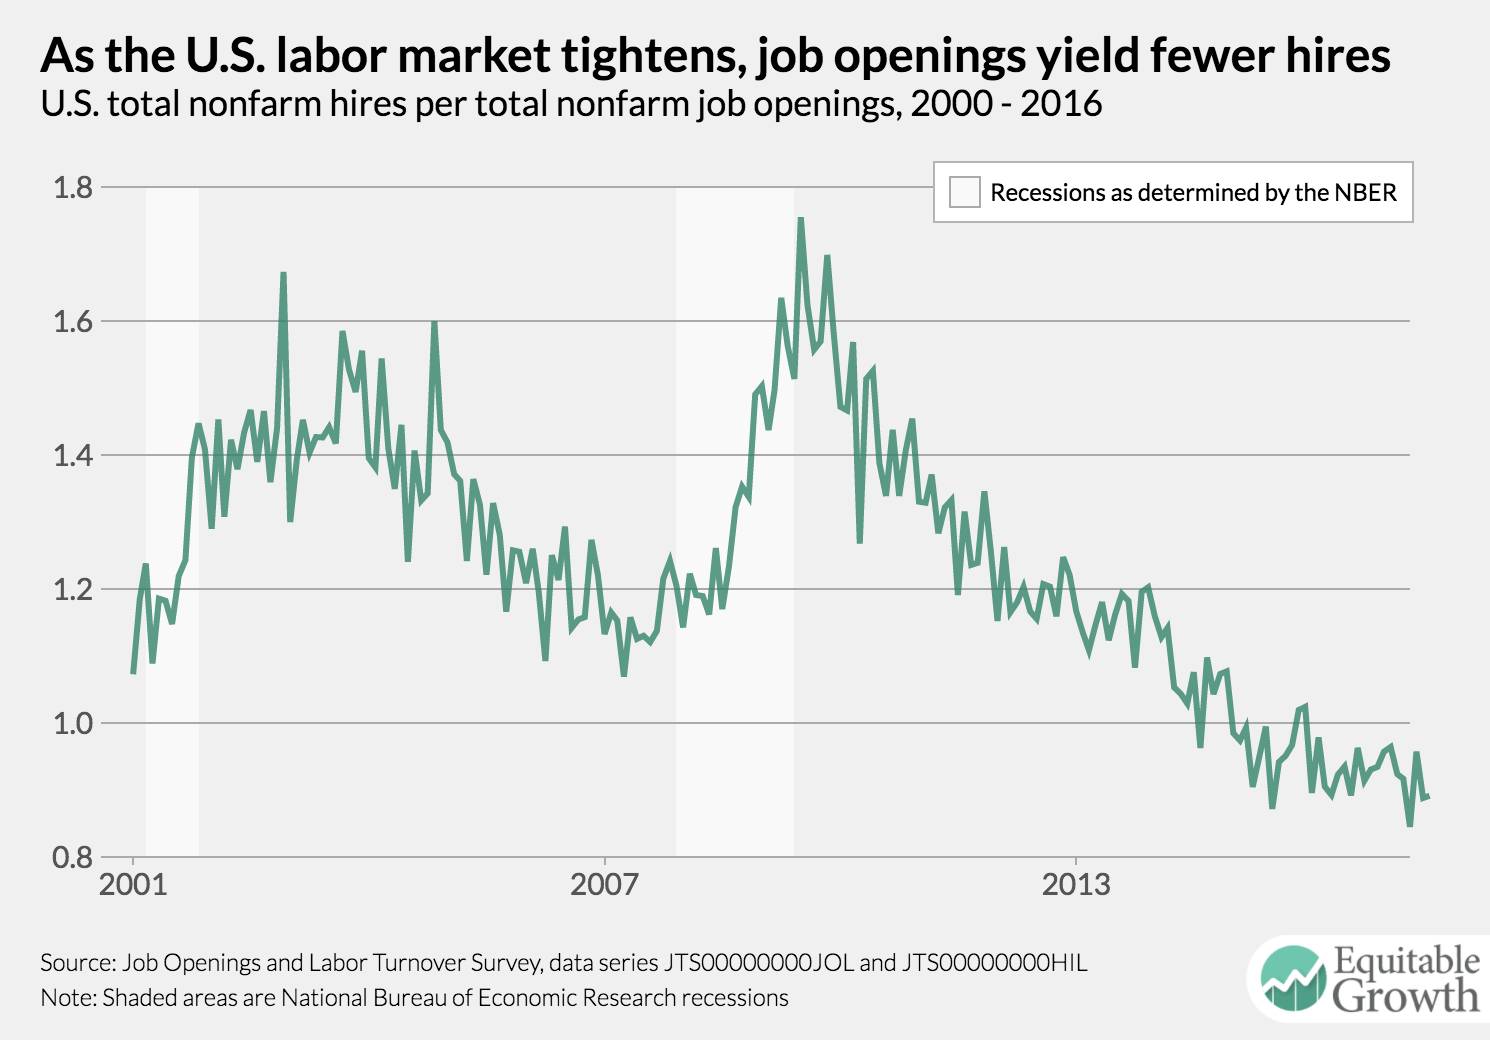
The number of hires per job opening—known as the vacancy yield—has settled at around 0.9 after falling throughout this recovery.
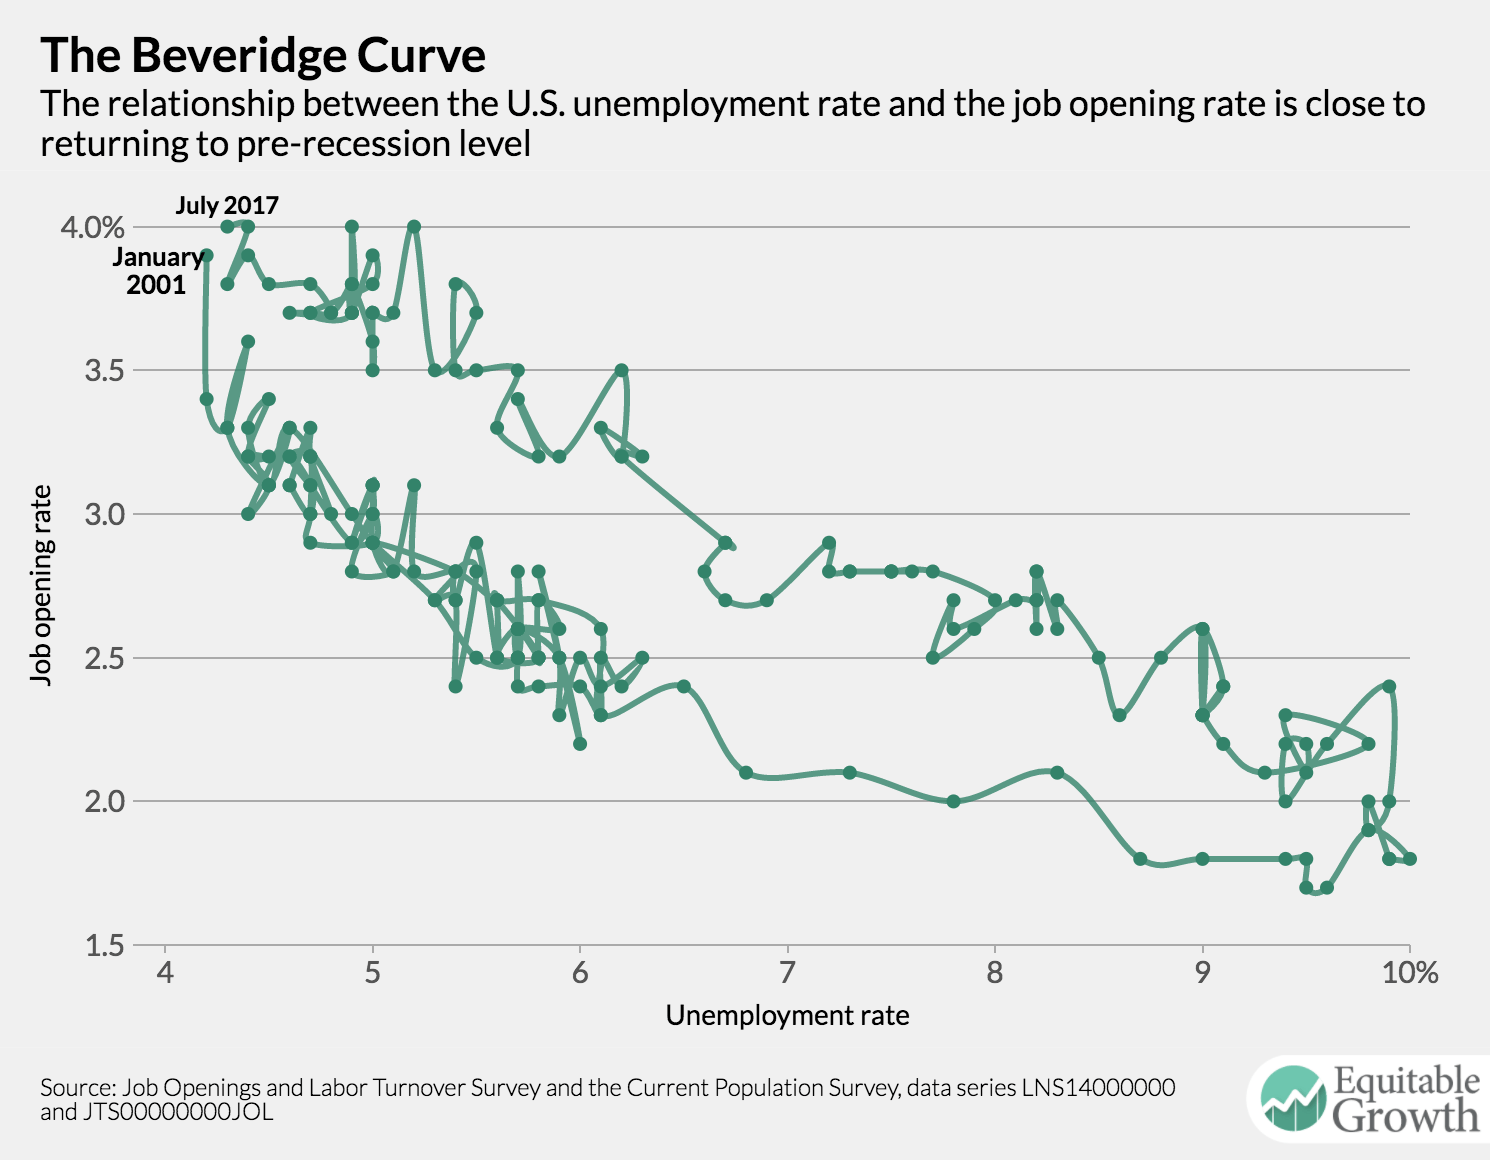
The Beveridge Curve in July looks to be very close to its pre-recession trend.