Putting the new U.S. Census data on income and poverty in context
Earlier this morning, the U.S. Census Bureau released new data on the state of incomes in 2014. According to the new data, the share of income going to the top 5 percent of American households is at 21.9 percent, a 0.3 percentage point decrease from 2013. Similarly, the Gini coefficient (a broad measure of income inequality) was essentially unchanged at 0.480. The official poverty rate stood still at 14.8 percent.
The important new data released today, however, are far from the only source of data on income and poverty trends in the United States. Other datasets paint a different story of family economic wellbeing. For instance, the flat levels of income inequality over the course of 2014 in the Census data diverge from evidence of rising inequality in other data on family incomes. Using tax data, University of California-Berkeley economist Emmanuel Saez finds that the share of income going to the top one percent increased by 1.1 percentage points in 2014. Understanding the state of income inequality and poverty in the United States means we have to be aware of what the Census data can and cannot tell us about the broader trends.
Case in point: it’s important to keep in mind what the Census Bureau considers as “income,” which can be defined in a number of ways. It could focus on income that’s earned strictly from work or investments (“market income”), or it could focus on income after accounting for the effects of government spending programs and taxes (“after-tax-and-transfer income”). The Census takes a third route with its preferred measure, called “money income.”
Money income includes some government programs (such as Social Security or unemployment compensation) but not all of them (such as in-kind transfers including the Supplemental Nutrition Assistance Program, also known as food stamps). It doesn’t include the value of some market income (such as employer-provided health insurance). And it doesn’t include the effects of taxation.
The difference between the Census’s definition of money income and data sources that use a different definition can paint different pictures of what’s happening to the U.S. economy.
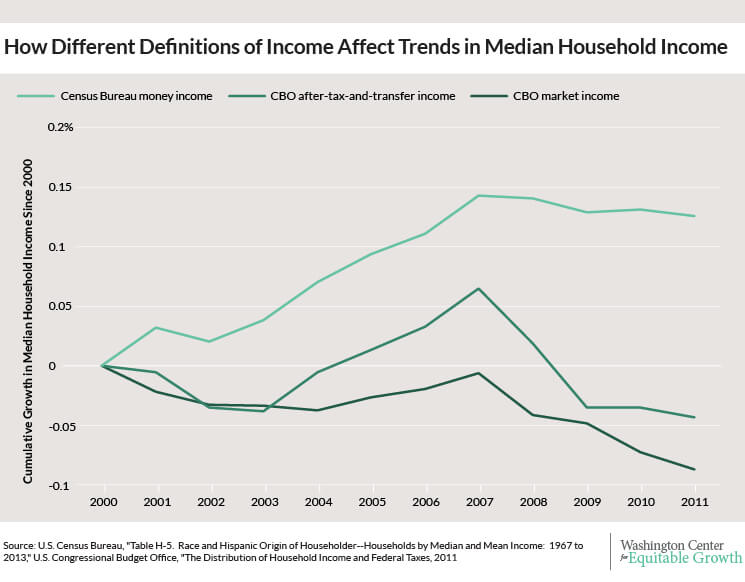
Consider trends in income for the median household (the household that’s directly in the middle of the distribution of income in the United States). According to the Census Bureau data using money income, median household income dropped by 8.7 percent from 2000 to 2011. But Congressional Budget Office data on after-tax-and-transfer income shows a much different picture. Over the same time period, that data set shows median household income increasing by 13 percent. The CBO data on market income show a decline of only 4.3 percent. (See Figure 1.)
Figure 1
Something similar happens when we look at the poverty rate in the United States. The Census Bureau’s official poverty rate shows an essentially flat trend over the past few decades, rising only from 14 percent in 1967 to 15 percent in 2012. But the official rate doesn’t include the effects of many anti-poverty programs that aren’t straight cash transfers.
Researchers at Columbia University created a series that accounts for these additional programs among other factors, and the trend is quite different from the official series—poverty starts much higher at 26 percent in 1967 and then declines to 16 percent in 2012. So while this trend shows a decline in the poverty rate over the years (due mainly to an expanded social safety net), it also illustrates the significant share of the population still in poverty. In 2014, the supplemental poverty measure was slightly above the official poverty rate.
The Census has its own preliminary alternative measure of poverty (the “Supplemental Poverty Measure”) that takes into account the research communities’ findings on how best to measure poverty. Like the Columbia University team’s measure, the Supplemental Poverty Measure also includes many anti-poverty programs that offer “in-kind” support rather than cash benefits. Today’s Census data using the Supplemental Poverty Measure pegs poverty at 15.3 in 2014.
The data released today are an important update on the state of income and poverty in the United States. The Census data fill out a picture of a U.S. economy where too many families are struggling, and where the typical family’s income remains 6.5 percent lower than it was prior to the Great Recession. While the Census figures certainly aren’t the final word on the issue, this release is a key addition to our ability to understand some of the most important trends—inequality and poverty—in the U.S. economy today.