JOLTS Day Graphs: October 2022 Edition

Every month the U.S. Bureau of Labor Statistics releases data on hiring, firing, and other labor market flows from the Job Openings and Labor Turnover Survey, better known as JOLTS. Today, the BLS released the latest data for October 2022. This report doesn’t get as much attention as the monthly Employment Situation Report, but it contains useful information about the state of the U.S. labor market. Below are a few key graphs using data from the report.

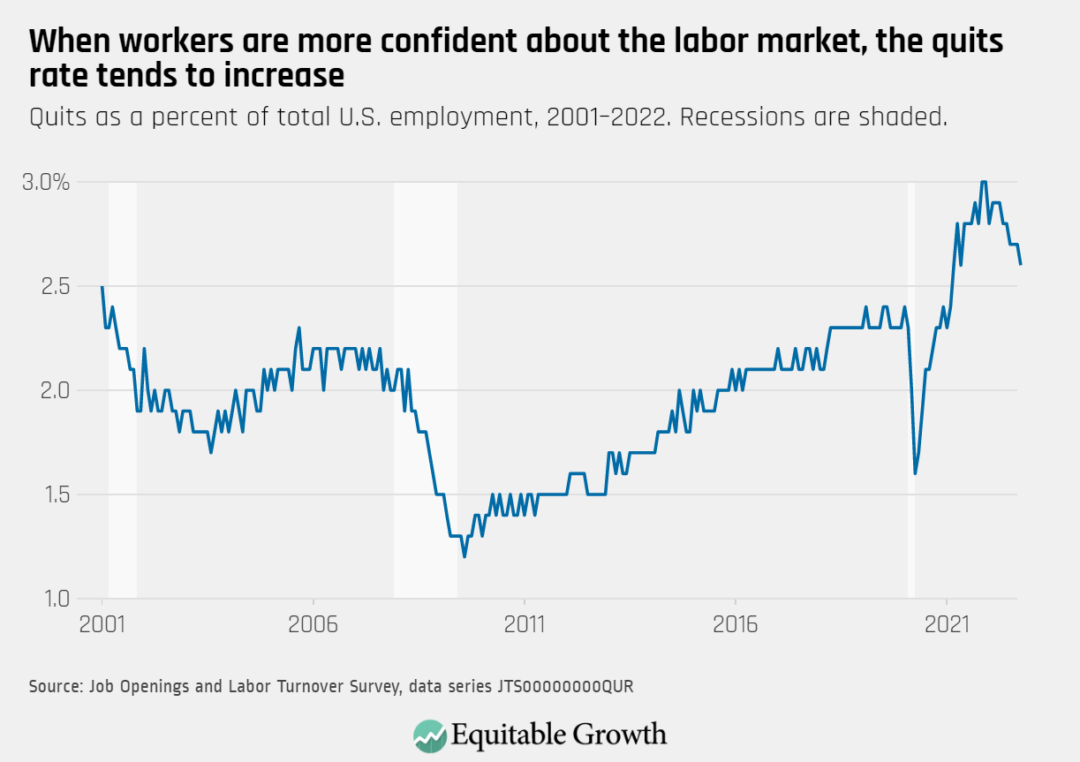
Around 4 million workers quit their jobs in October, similar to the previous month, and the quits rate declined to 2.6 percent for the first time since May 2021.

Quits as a percent of total U.S. employment, 2001–2022. Recessions are shaded.

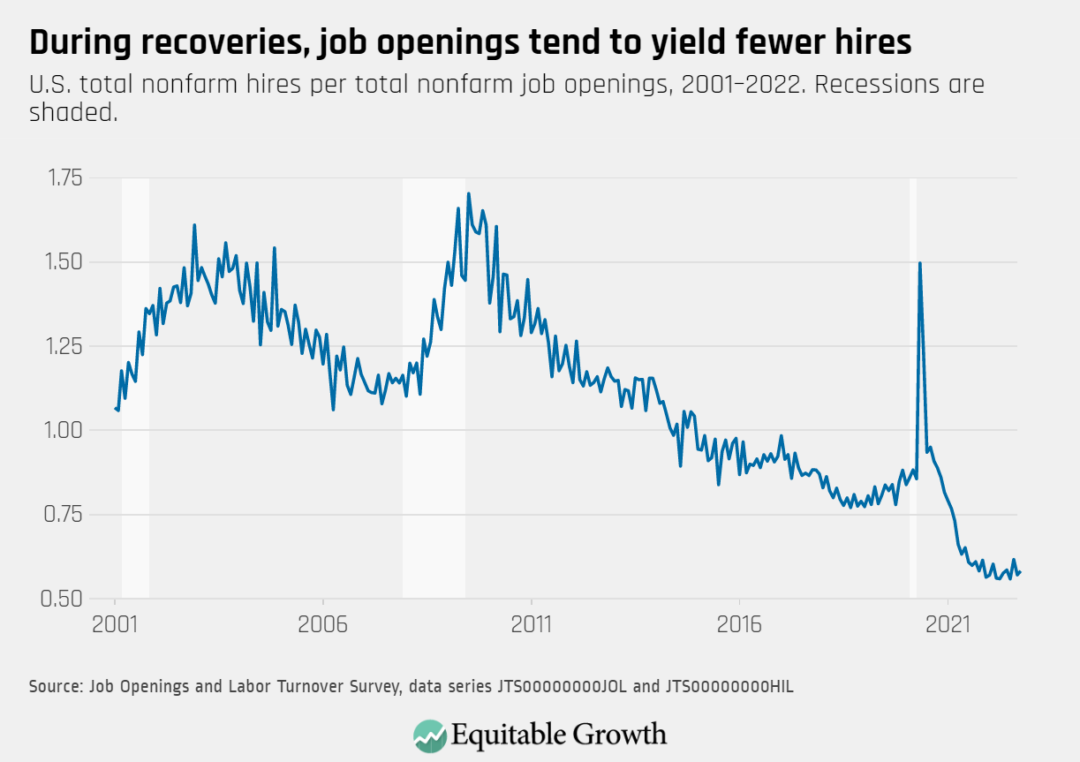
The vacancy yield increased to 0.58 in October from 0.57 in September as the number of reported job openings declined to 10.3 million while hires remained relatively constant at 6.0 million.

U.S. total nonfarm hires per total nonfarm job openings, 2001–2022. Recessions are shaded.

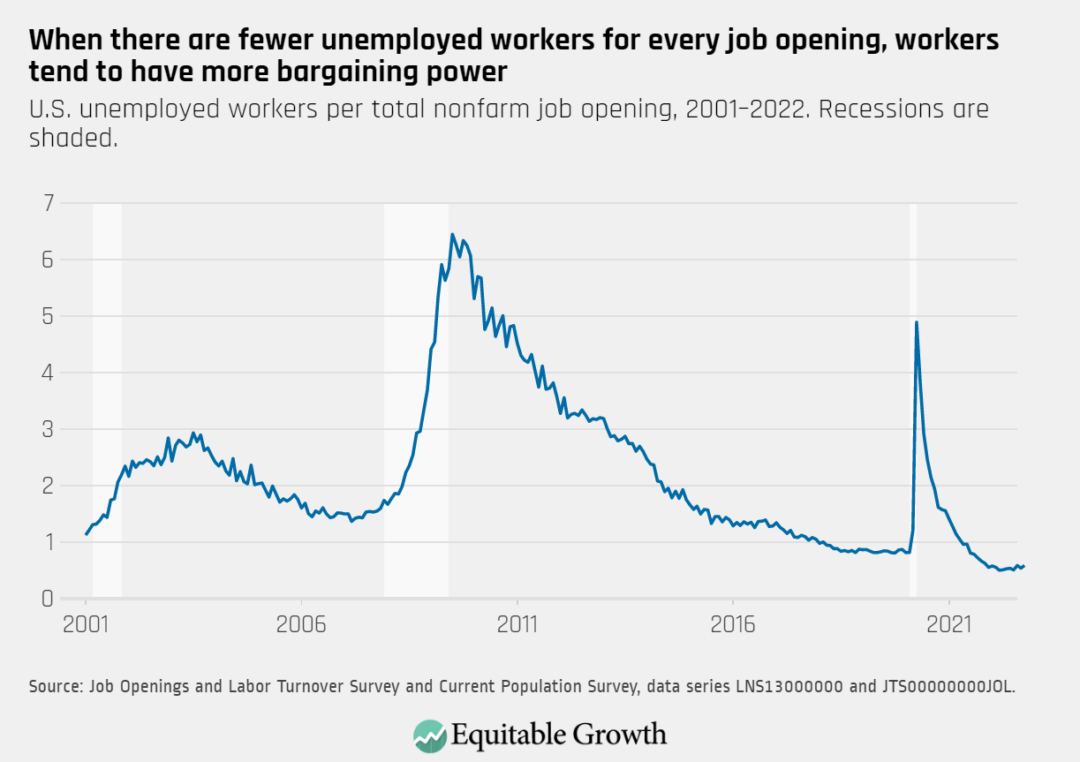
The ratio of unemployed workers to job openings increased to almost 0.59 in October from just under 0.54 in September.

U.S. unemployed workers per total nonfarm job opening, 2001–2022. Recessions are shaded.

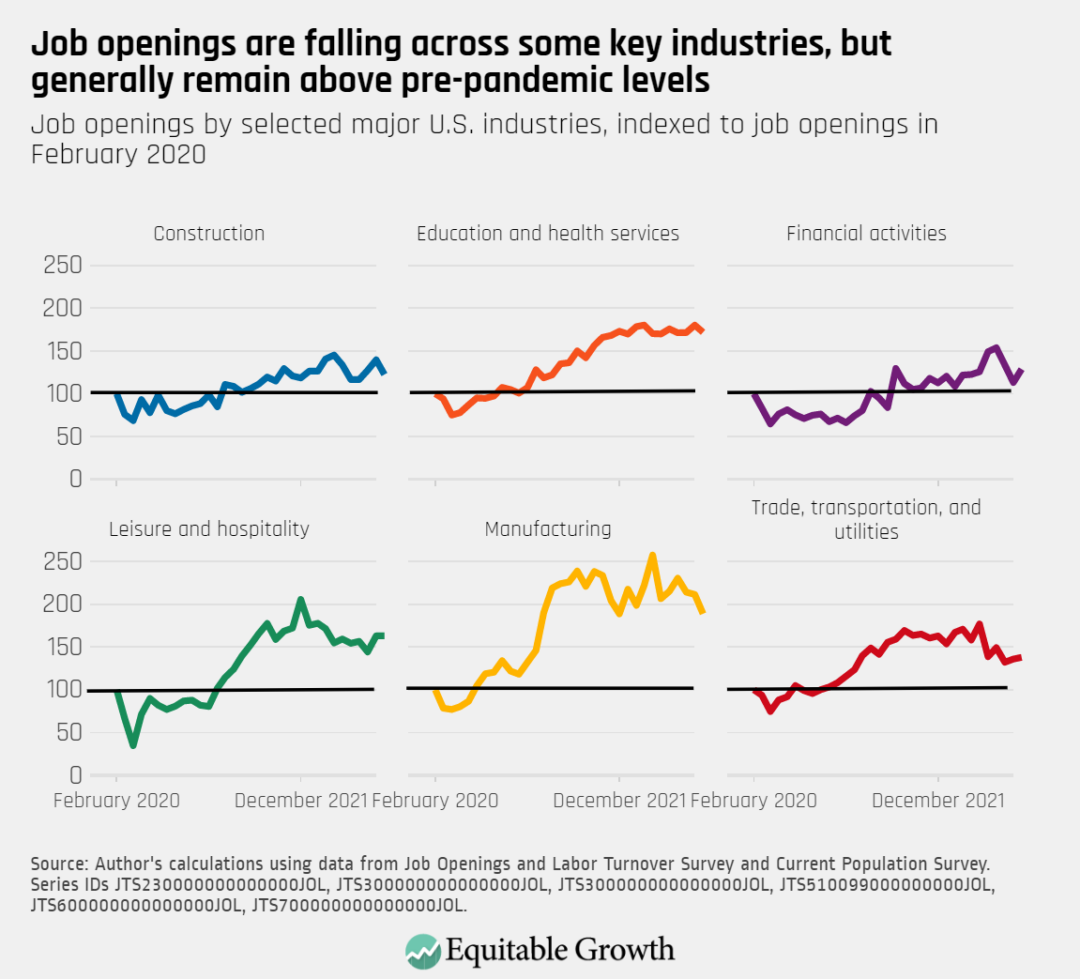
Job openings ticked down but remain elevated in industries such as education and health services and in manufacturing, and remained steady in leisure and hospitality.

Job openings by selected major U.S. industries, indexed to job openings in February 2020
Connect with us!

Explore the Equitable Growth network of experts around the country and get answers to today's most pressing questions!

Get in Touch