JOLTS Day Graphs: November 2022 Edition

Every month the U.S. Bureau of Labor Statistics releases data on hiring, firing, and other labor market flows from the Job Openings and Labor Turnover Survey, better known as JOLTS. Today, the BLS released the latest data for November 2022. This report doesn’t get as much attention as the monthly Employment Situation Report, but it contains useful information about the state of the U.S. labor market. Below are a few key graphs using data from the report.

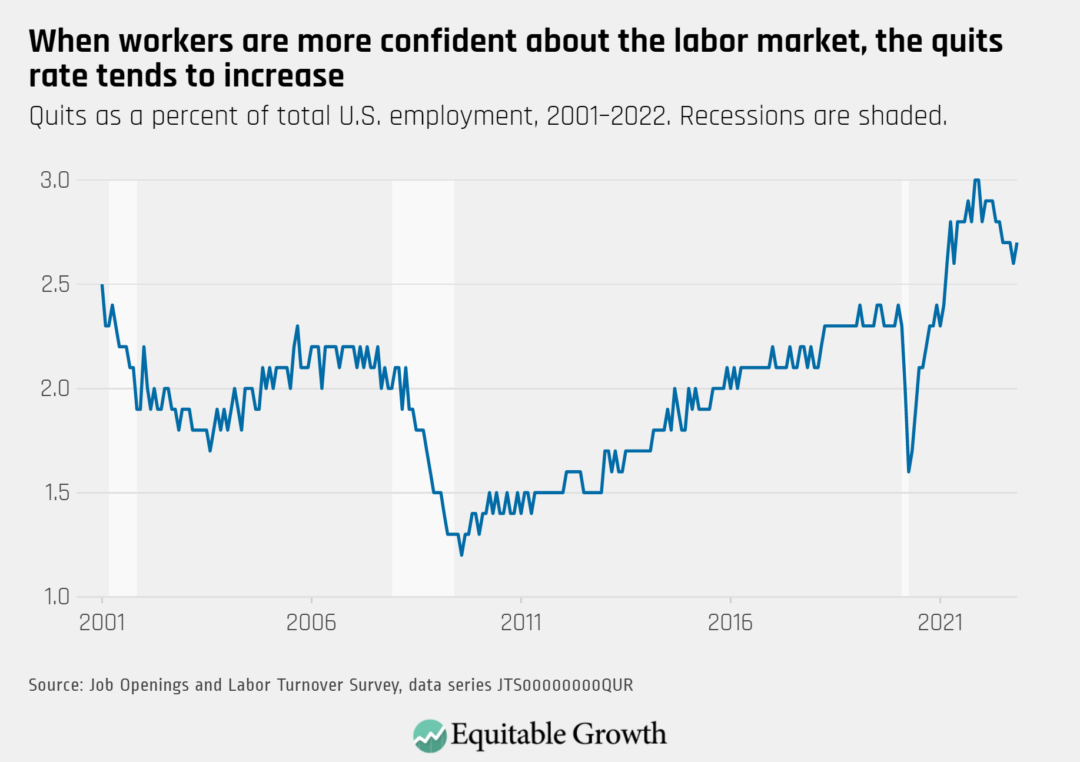
The quits rate remained relatively steady in November 2022, increasingly slightly to 2.7 percent as 4.2 million workers quit their jobs.

Quits as a percent of total U.S. employment, 2001–2022. Recessions are shaded.

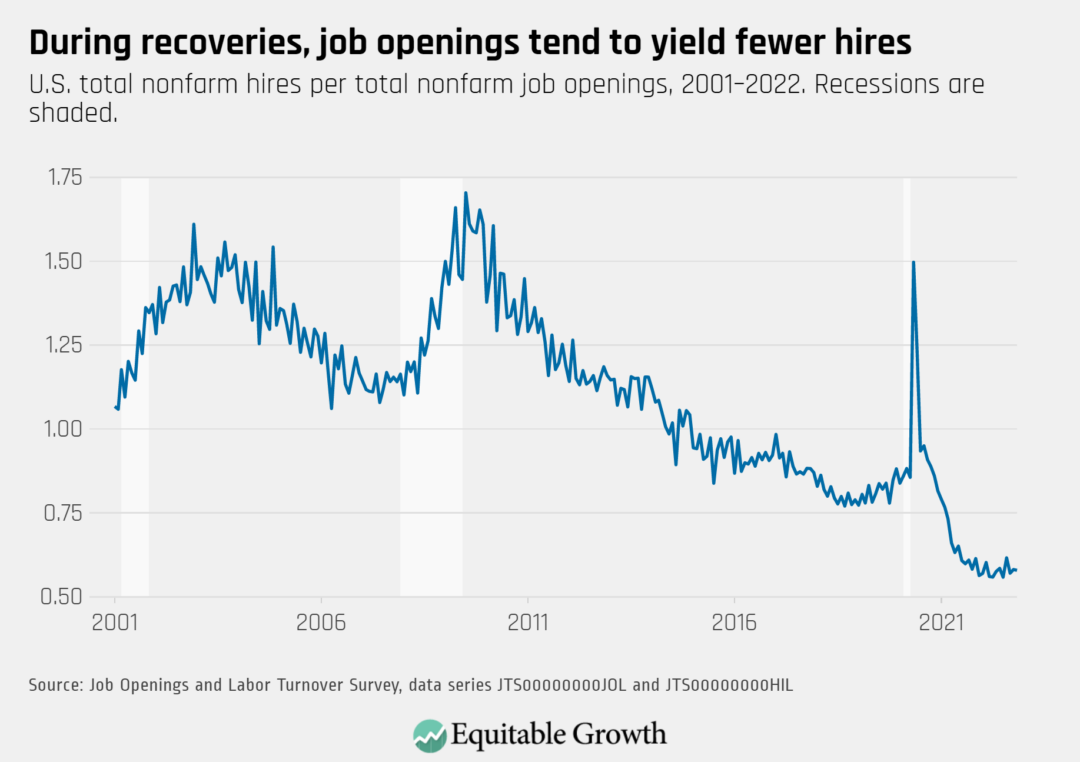
With the number of job openings (10.5 million) and hires (6.1 million) remaining at similar levels to the previous month, the vacancy yield stayed at 0.58 in November.

U.S. total nonfarm hires per total nonfarm job openings, 2001–2022. Recessions are shaded.

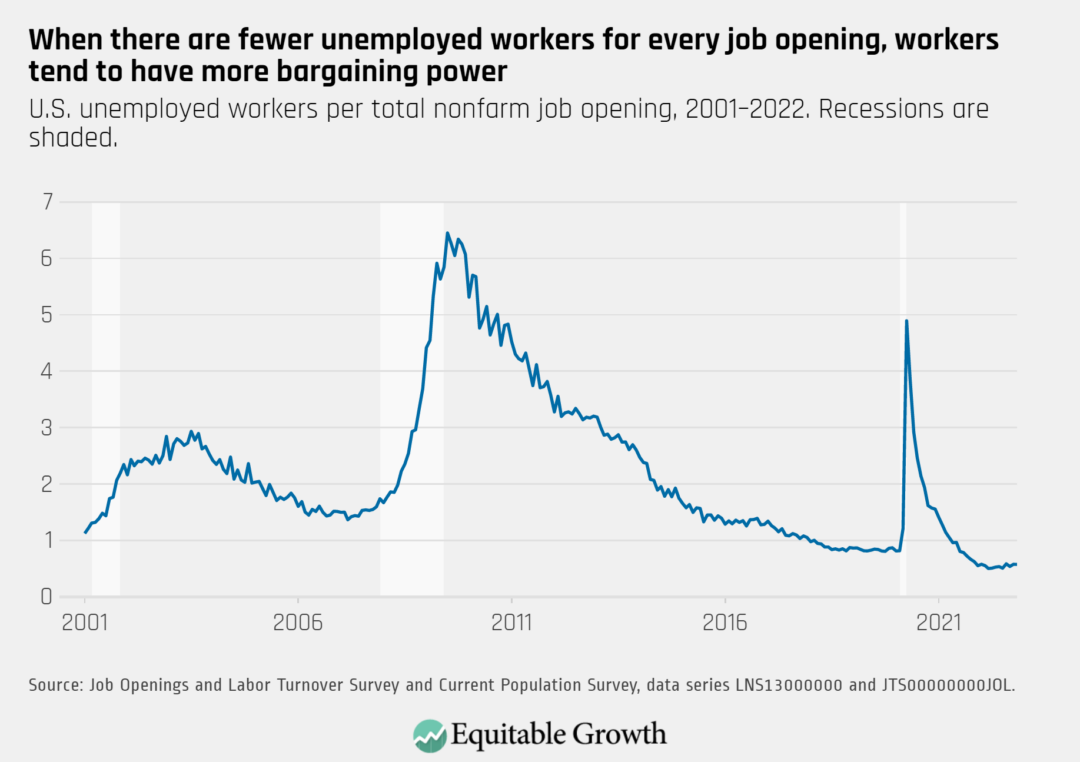
There were 0.57 unemployed workers for every job opening in November, reflecting the relatively steady state of the unemployment rate and the job openings rate.

U.S. unemployed workers per total nonfarm job opening, 2001–2022. Recessions are shaded.

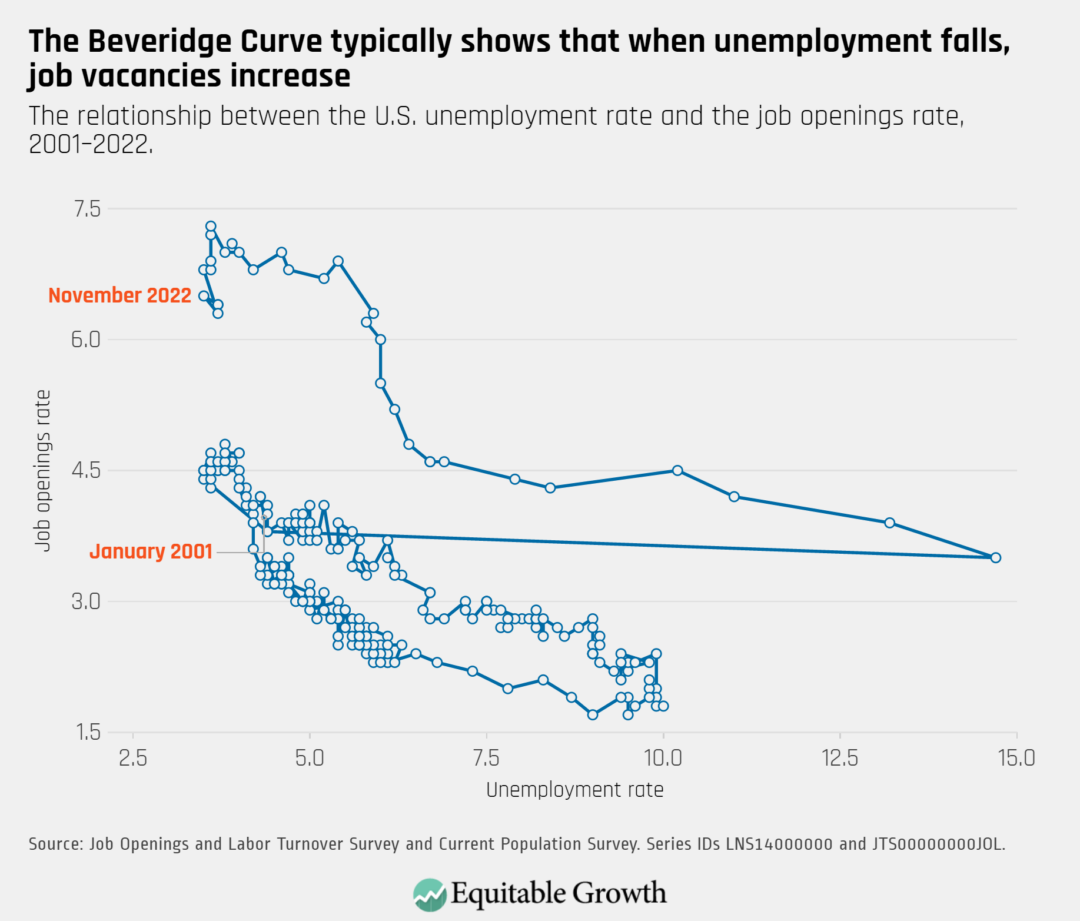
The Beveridge Curve, which shows the relationship between job openings and unemployment, likewise did not reflect any movement in November 2022.

The relationship between the U.S. unemployment rate and the job openings rate, 2001–2022.

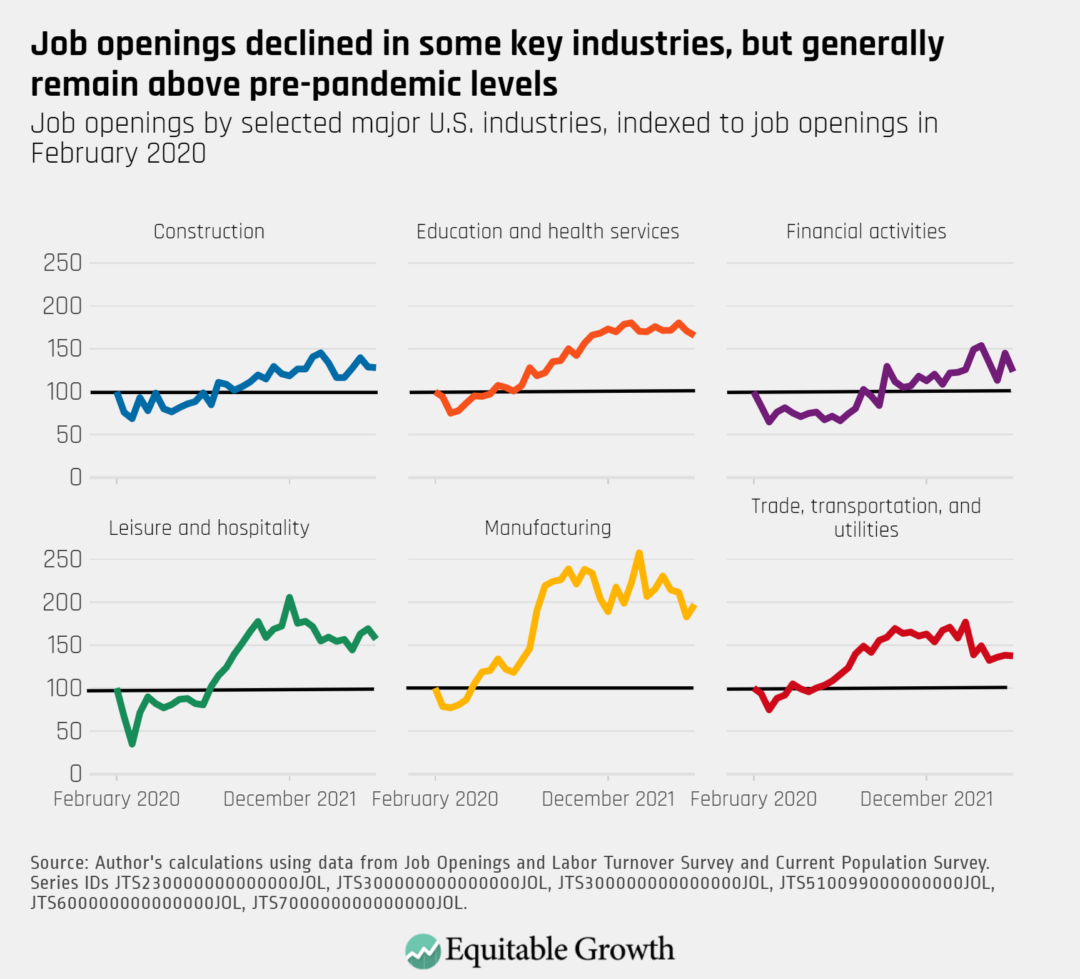
Overall job openings remained near 10.5 million in November, but declined in sectors such as education and health services, financial activities, and leisure and hospitality.

Job openings by selected major U.S. industries, indexed to job openings in February 2020
Connect with us!

Explore the Equitable Growth network of experts around the country and get answers to today's most pressing questions!

Get in Touch