JOLTS Day Graphs: March 2023 Edition
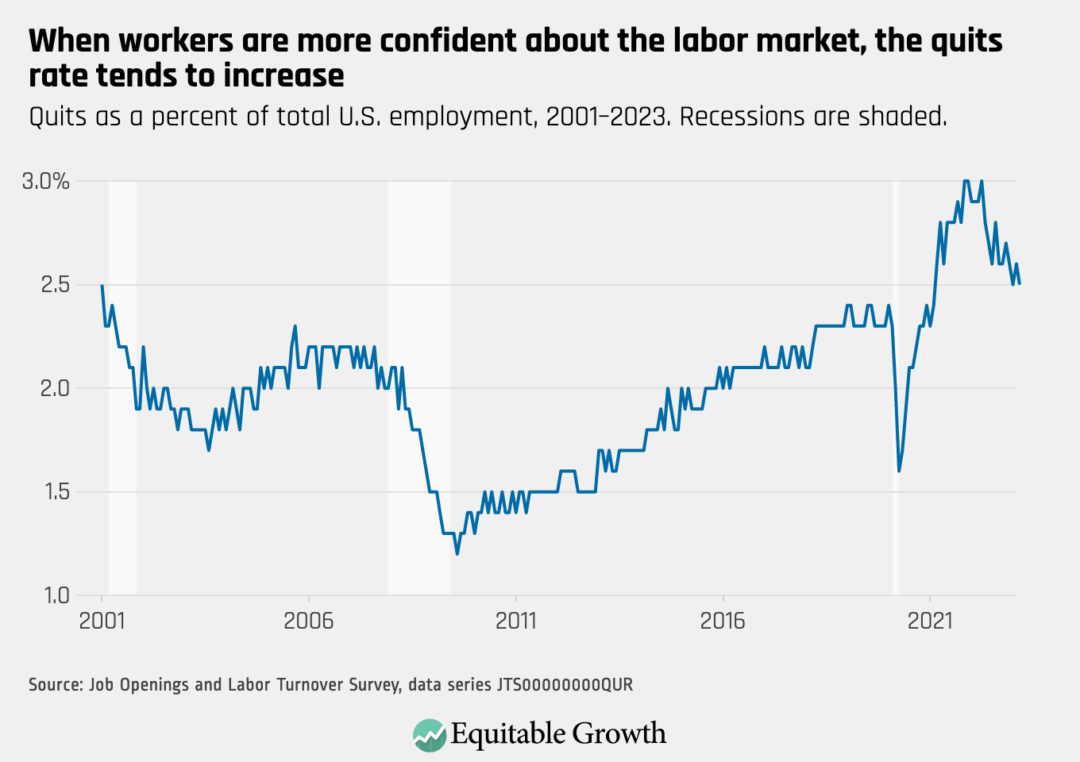
The quits rate declined slightly to 2.5 percent as 3.9 million workers quit their jobs in March 2023.
![Quits as a percent of total U.S. employment, 2001–2023. Recessions are shaded.](https://equitablegrowth.org/wp-content/uploads/2023/05/playfair-2023-05-02T070228.880-1080x762.png)
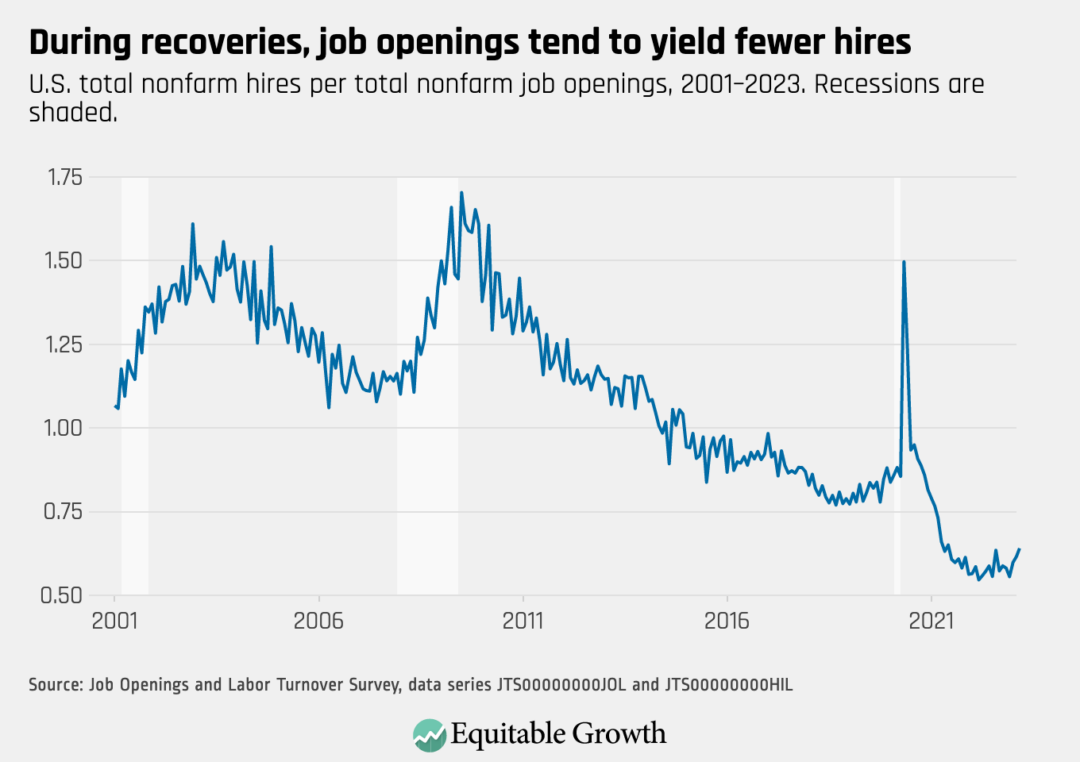
The vacancy yield increased in March as job openings fell to 9.6 million and hires declined slightly to 6.1 million.
![U.S. total nonfarm hires per total nonfarm job openings, 2001–2023. Recessions are shaded.](https://equitablegrowth.org/wp-content/uploads/2023/05/playfair-2023-05-02T070337.129-1080x762.png)
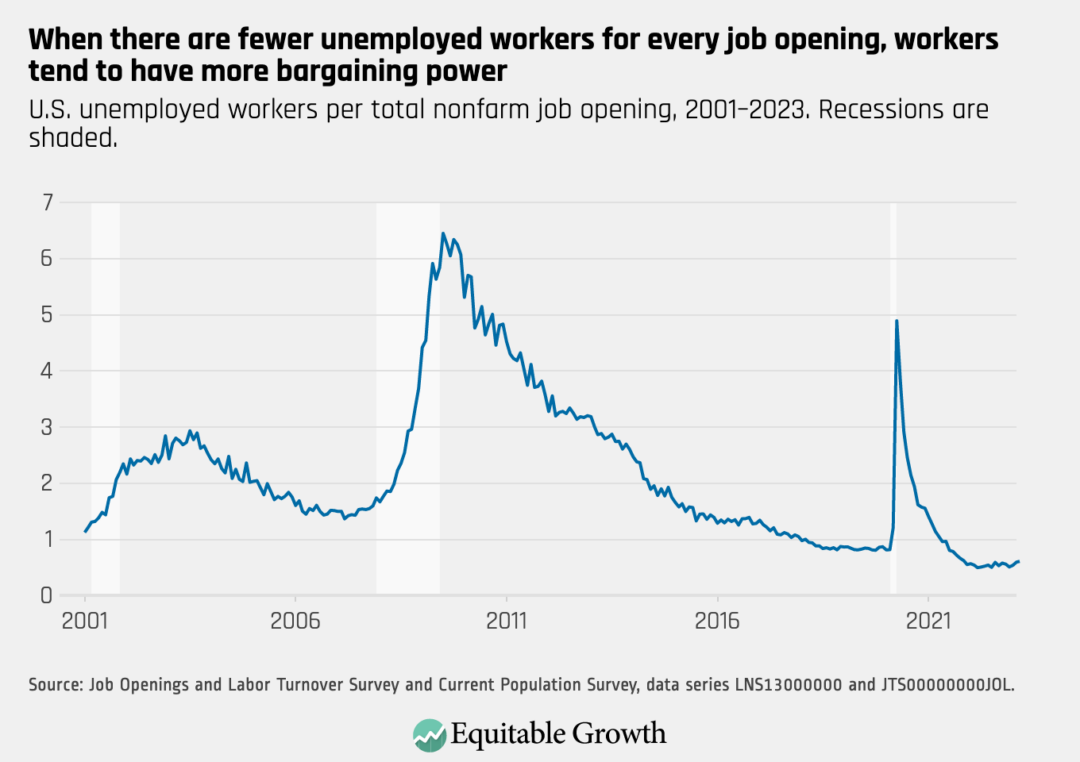
The ratio of unemployed workers to job openings did not change dramatically in March, as both unemployment and job openings ticked down.
![U.S. unemployed workers per total nonfarm job opening, 2001–2023. Recessions are shaded.](https://equitablegrowth.org/wp-content/uploads/2023/05/playfair-2023-05-02T070853.061-1080x762.png)
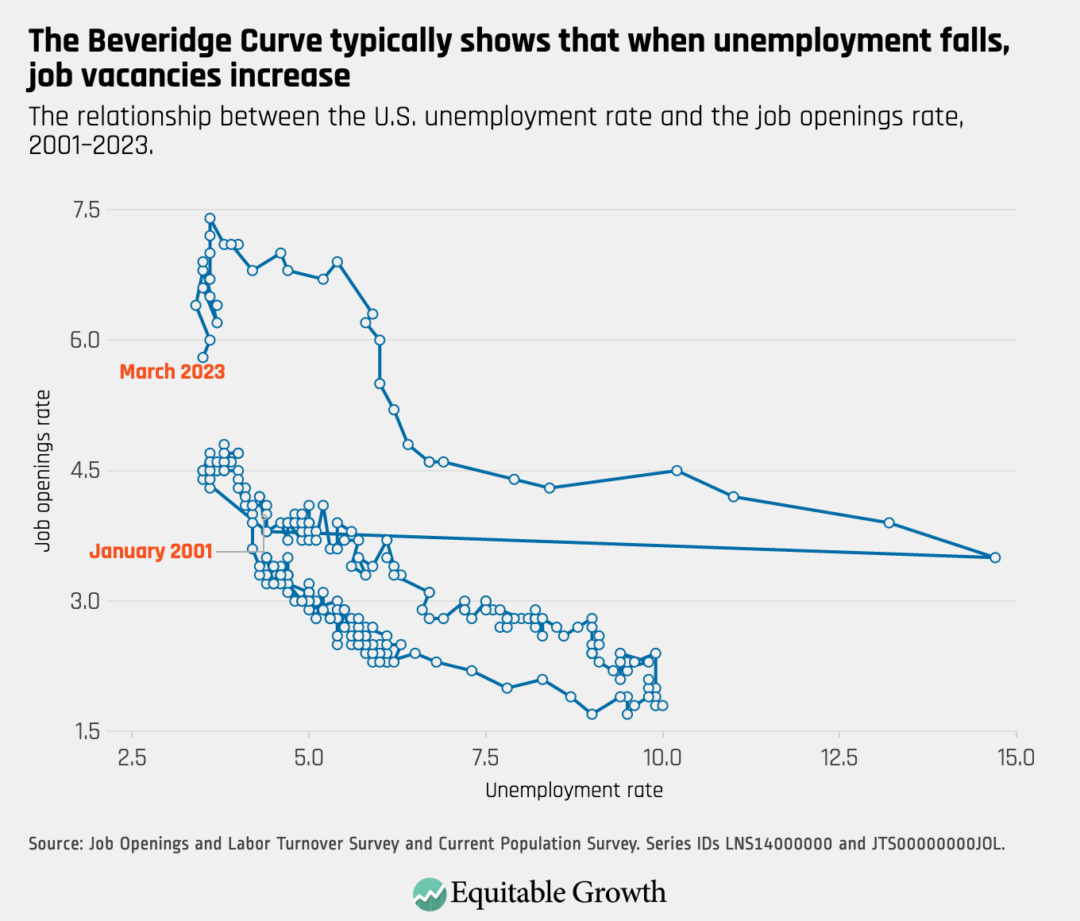
The Beveridge Curve moved downward and to the left in March, as the unemployment rate and rate of job openings both declined.
![The relationship between the U.S. unemployment rate and the job openings rate, 2001–2023.](https://equitablegrowth.org/wp-content/uploads/2023/05/playfair-2023-05-02T070645.746-1080x921.png)
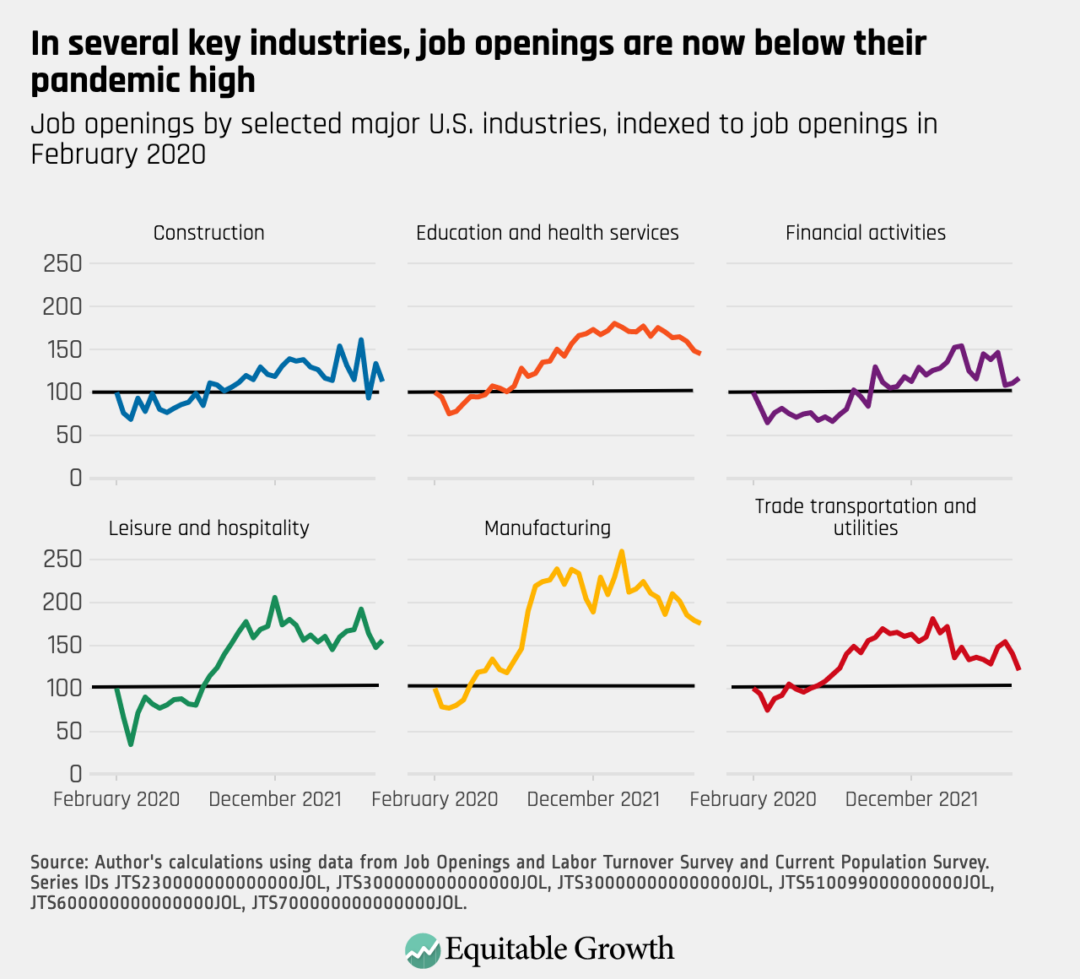
The number of job openings decreased by 384,000 in March, including continued declines in sectors such as education and health services, manufacturing, and trade, transportation, and utilities.
![Job openings by selected major U.S. industries, indexed to job openings in February 2020](https://equitablegrowth.org/wp-content/uploads/2023/05/playfair-2023-05-02T071059.119-1080x979.png)