JOLTS Day Graphs: June 2022 Edition

Every month the U.S. Bureau of Labor Statistics releases data on hiring, firing, and other labor market flows from the Job Openings and Labor Turnover Survey, better known as JOLTS. Today, the BLS released the latest data for June 2022. This report doesn’t get as much attention as the monthly Employment Situation Report, but it contains useful information about the state of the U.S. labor market. Below are a few key graphs using data from the report.

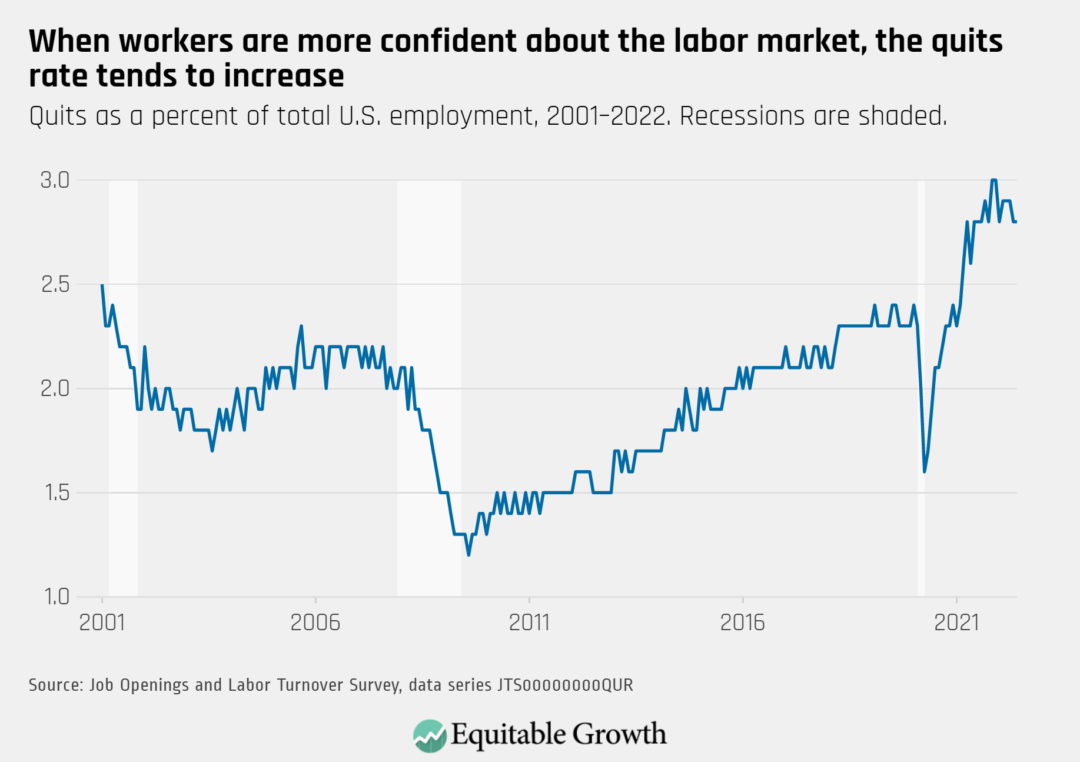
The quits rate remained at 2.8 percent as 4.2 million workers quit their jobs in June 2022.

Quits as a percent of total U.S. employment, 2001–2022. Recessions are shaded.

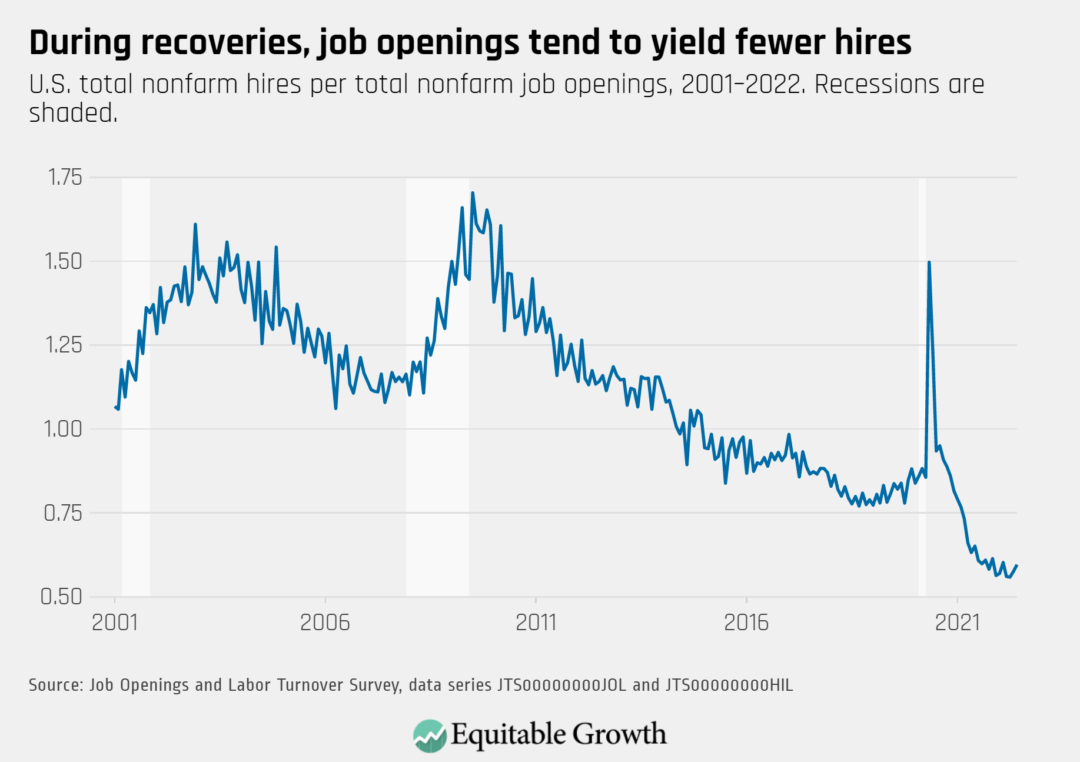
The vacancy yield remains low but increased to about 0.60 in June from 0.58 in May, as the number of reported job openings declined and hires saw little change.

U.S. total nonfarm hires per total nonfarm job openings, 2001–2022. Recessions are shaded.

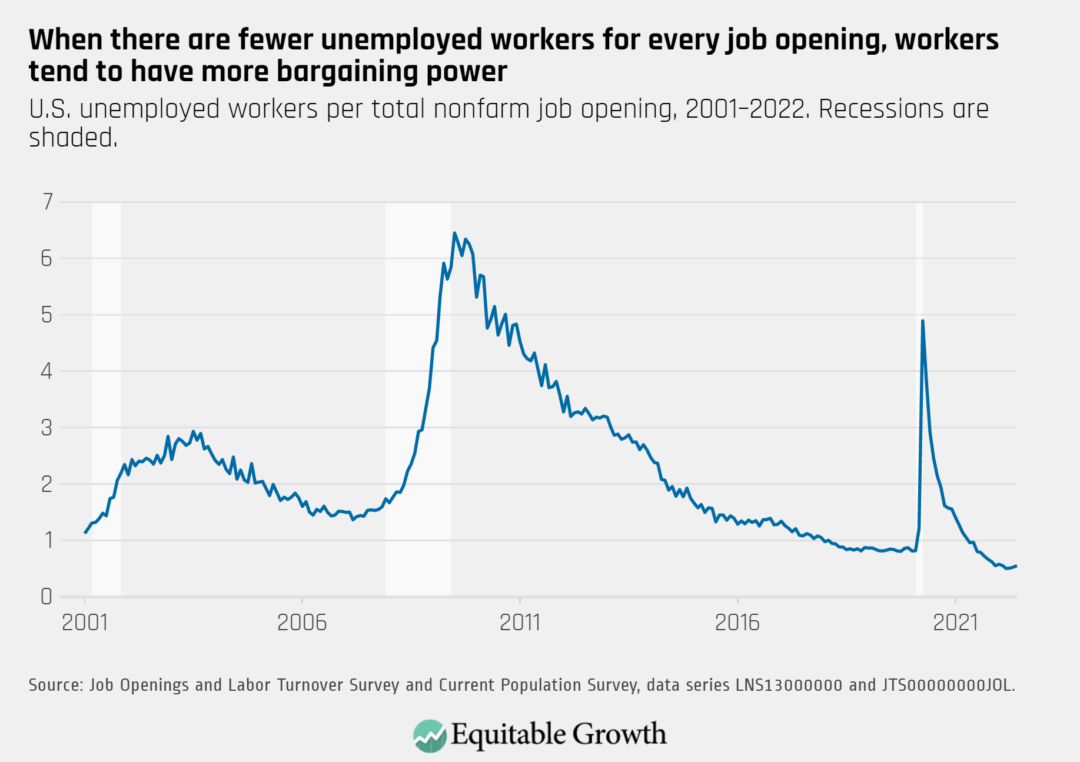
The ratio of unemployed-workers-to-job-openings increased in June to 0.55 from 0.53 in May.

U.S. unemployed workers per total nonfarm job opening, 2001–2022. Recessions are shaded.

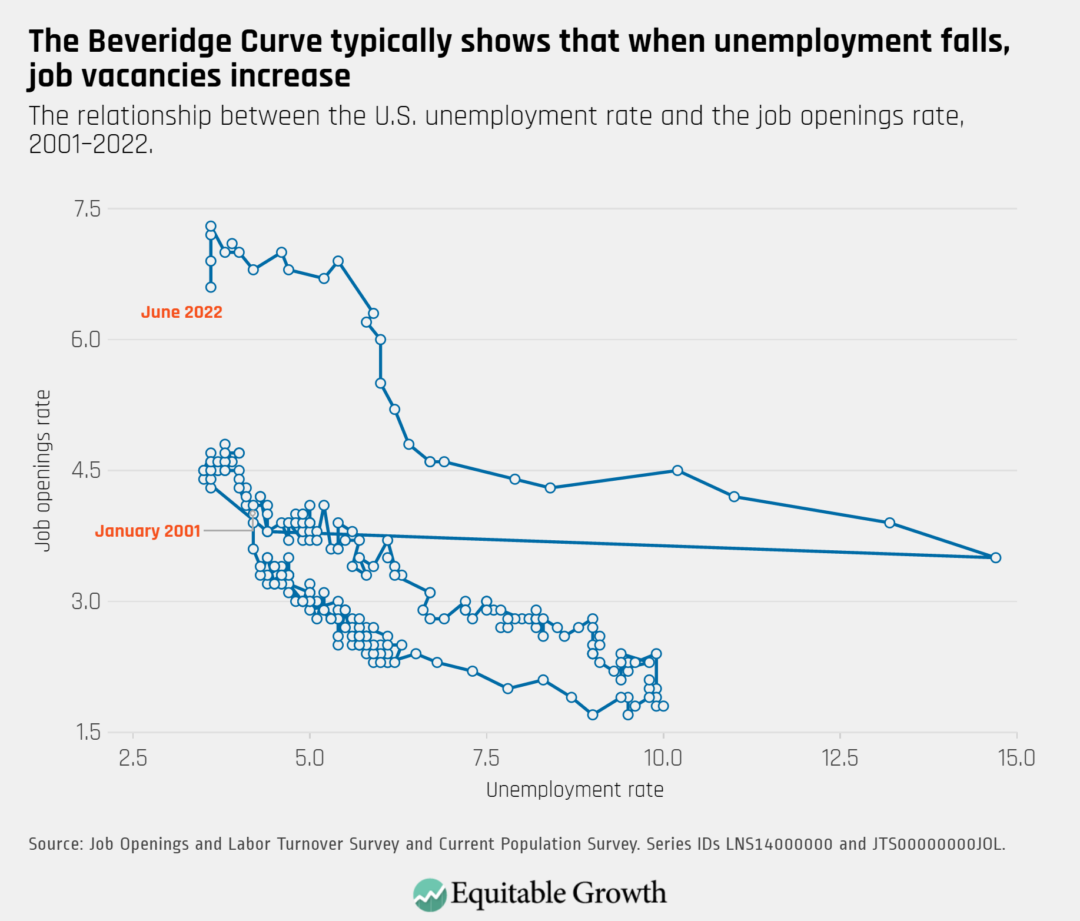
The Beveridge Curve moved downward in June, reflecting a decline in the job openings rate while unemployment remained unchanged.

The relationship between the U.S. unemployment rate and the job openings rate, 2001–2022.

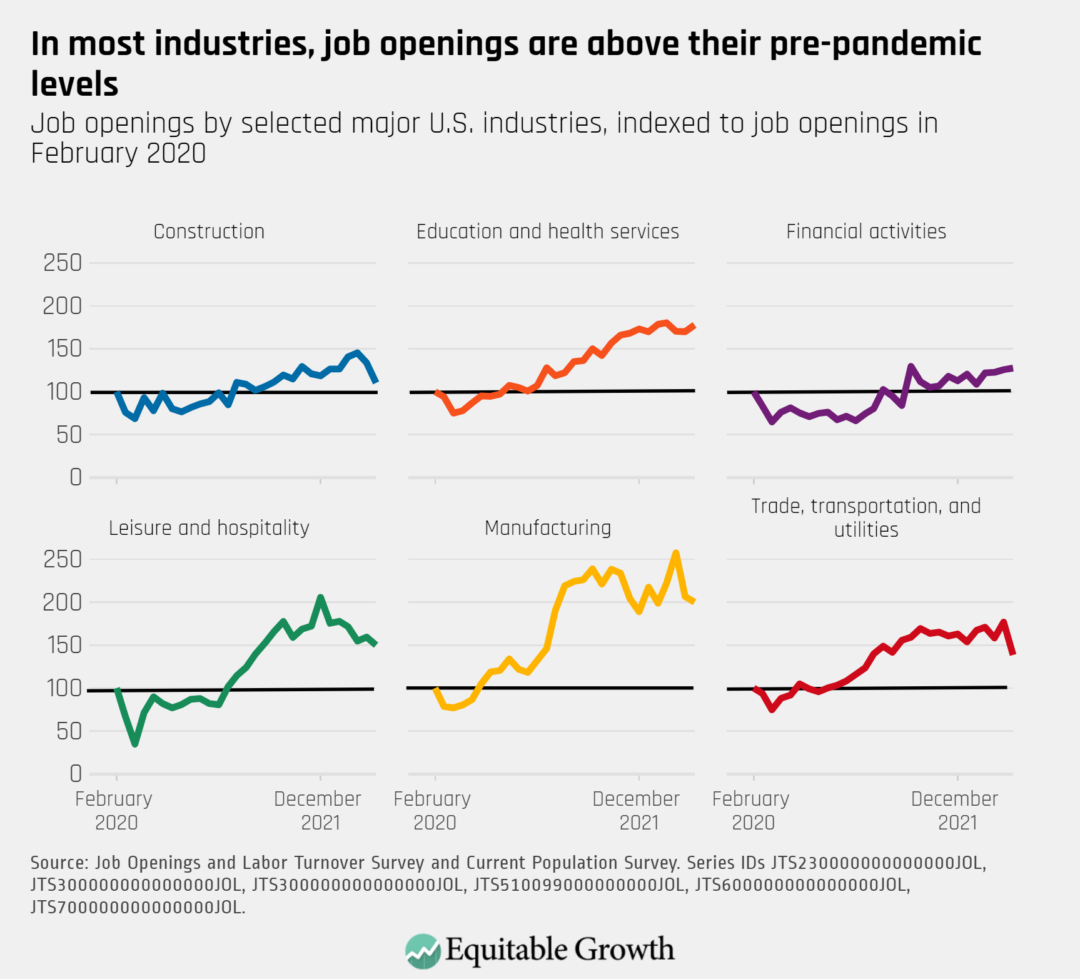
The overall number of job openings decreased by 605,000 in June (6.6 percent) to 10.7 million, falling in industries such as construction, leisure and hospitality, and trade, transportation, and utilities.

Job openings by selected major U.S. industries, indexed to job openings in February 2020
Connect with us!

Explore the Equitable Growth network of experts around the country and get answers to today's most pressing questions!

Get in Touch