JOLTS Day Graphs: June 2019 Report Edition
1.
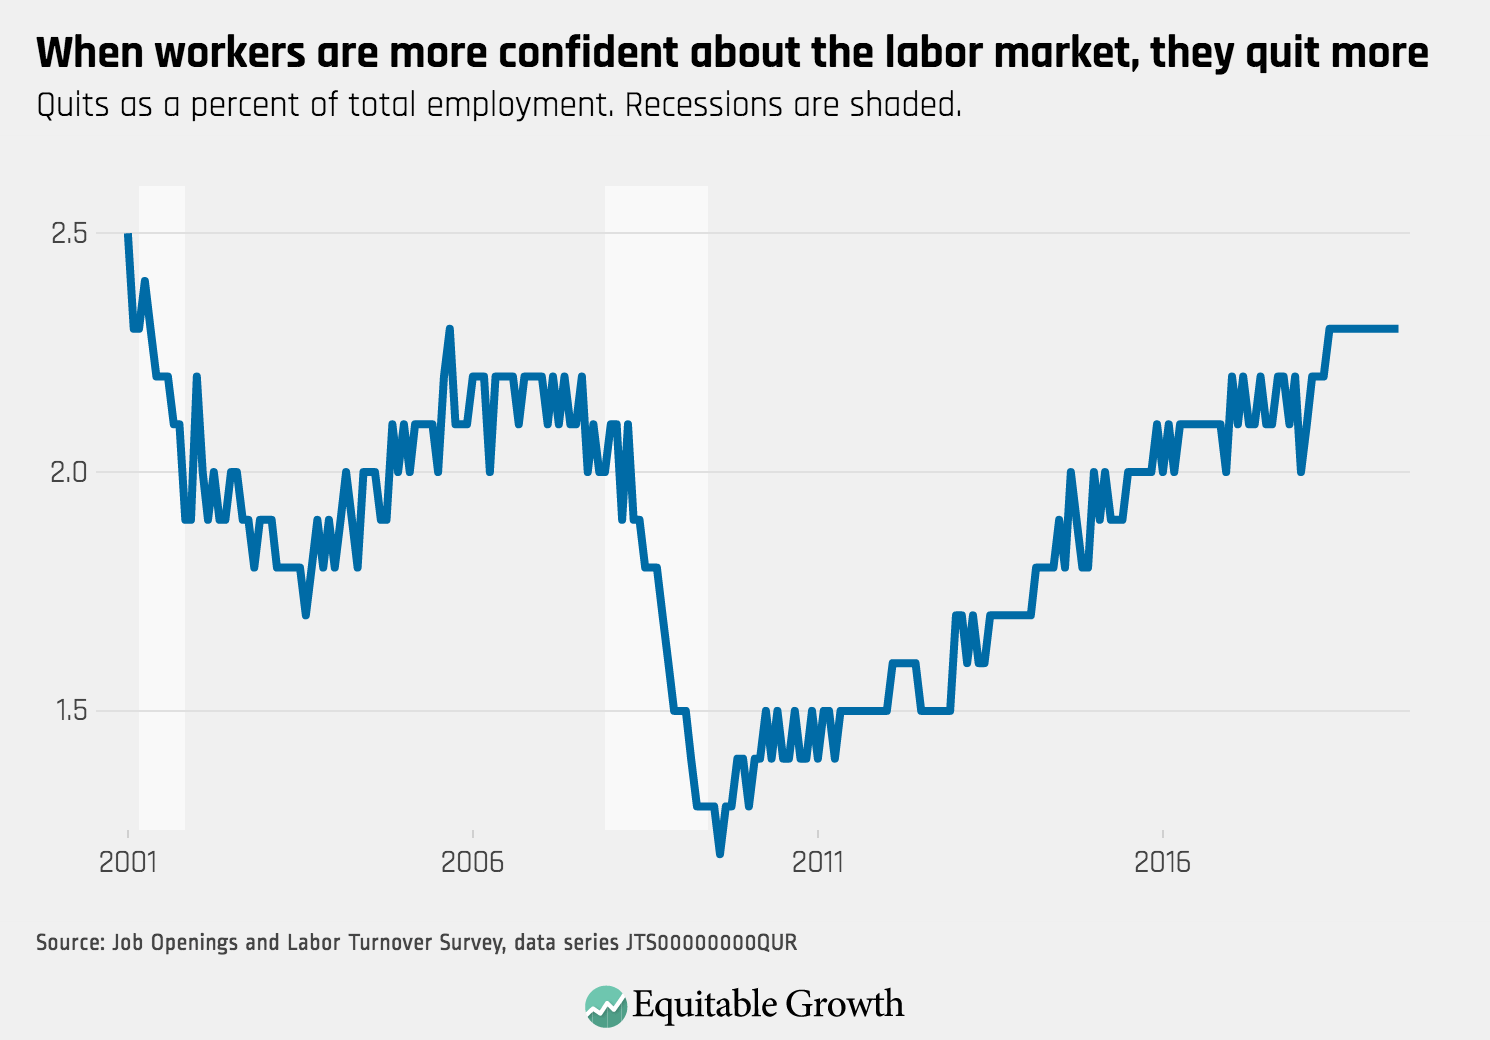
The quit rate has held steady at 2.3% for over a year, reflecting workers’ confidence in finding other opportunities and voluntarily leaving their jobs.
2.
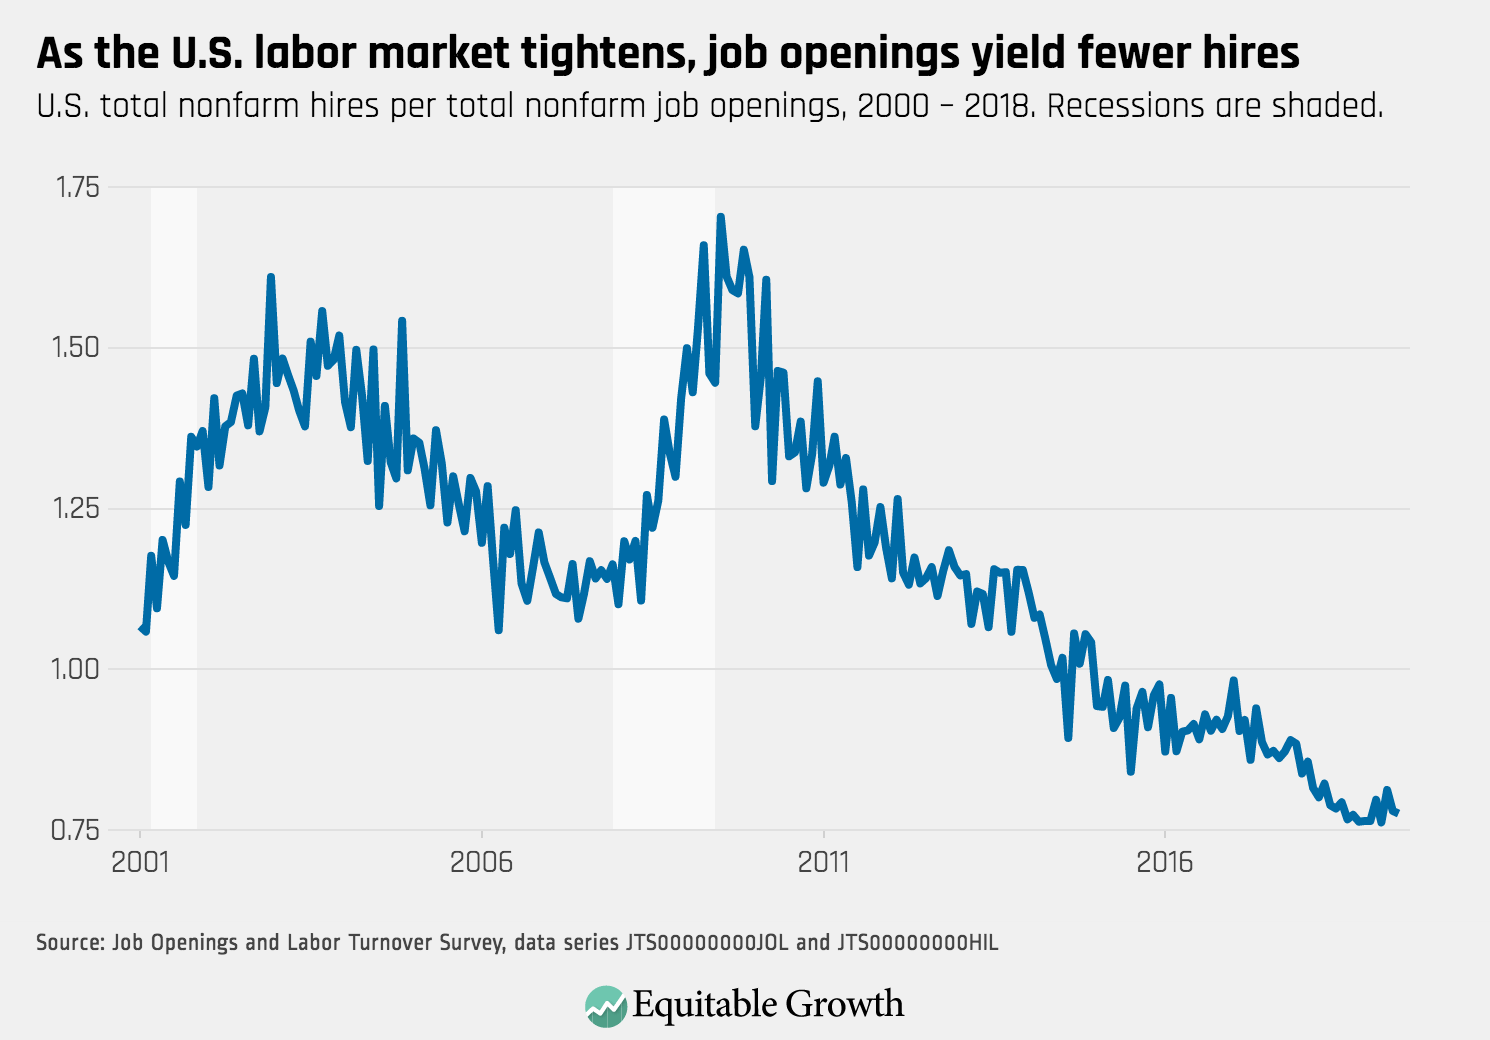
The jobs openings rate declined slightly to 4.6% while the hire rate was unchanged at 3.8%, so the labor market still appears tight with more openings than hires.
3.
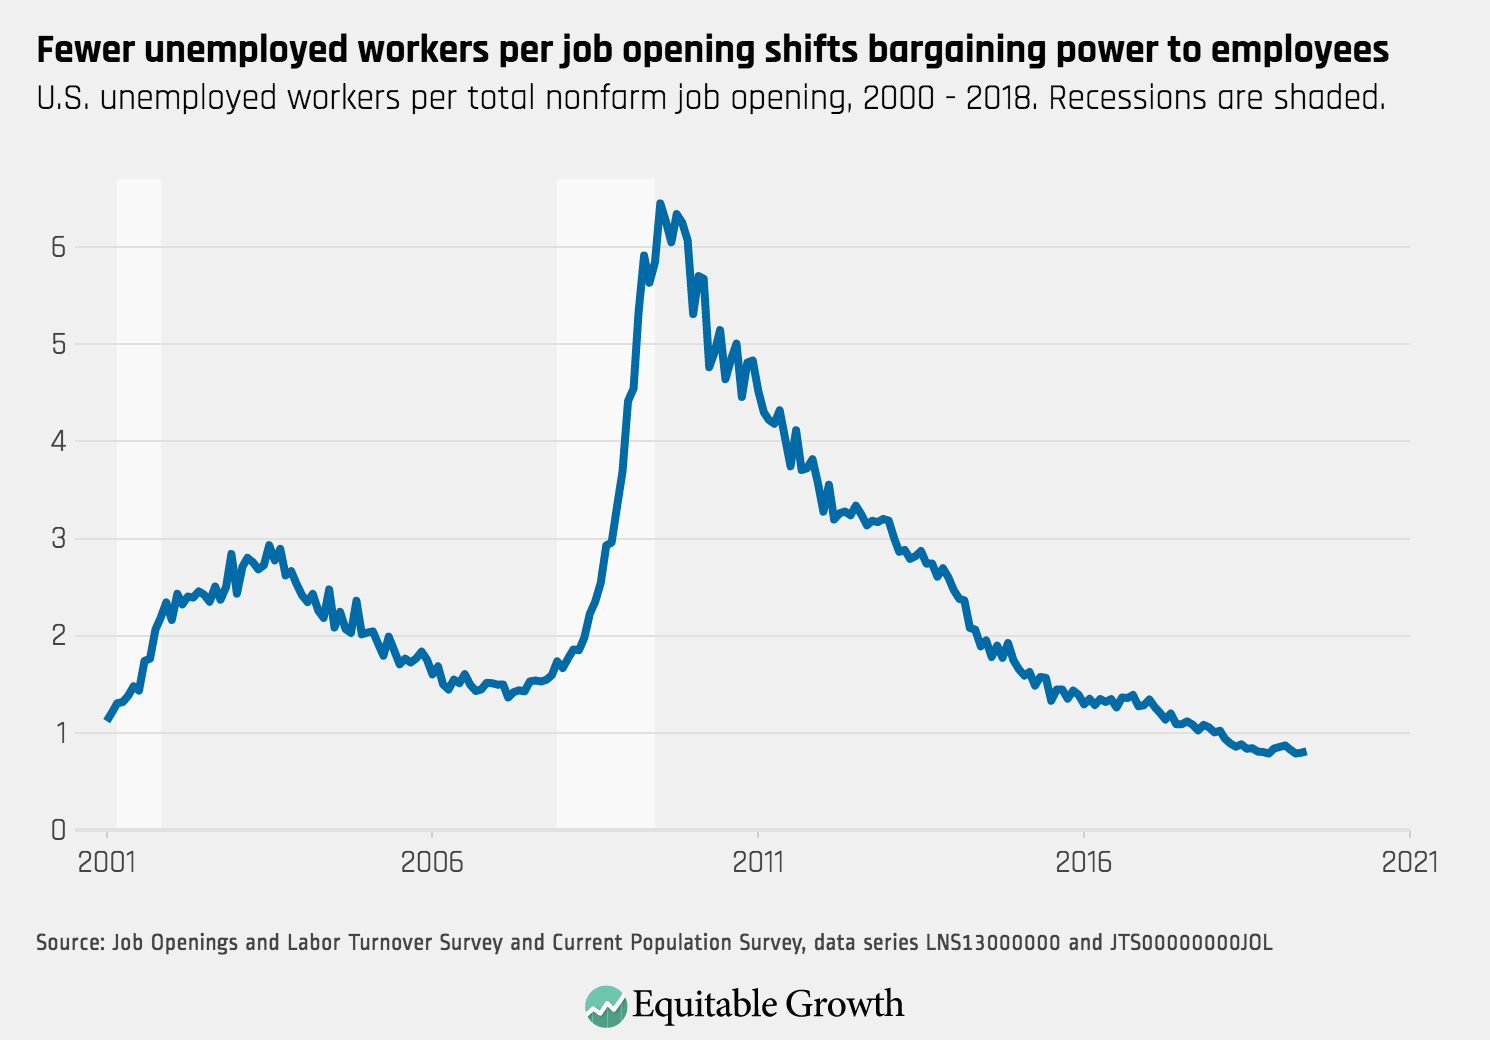
There continues to be fewer than one unemployed worker per job opening, which has the potential to increase the bargaining power of job seekers.
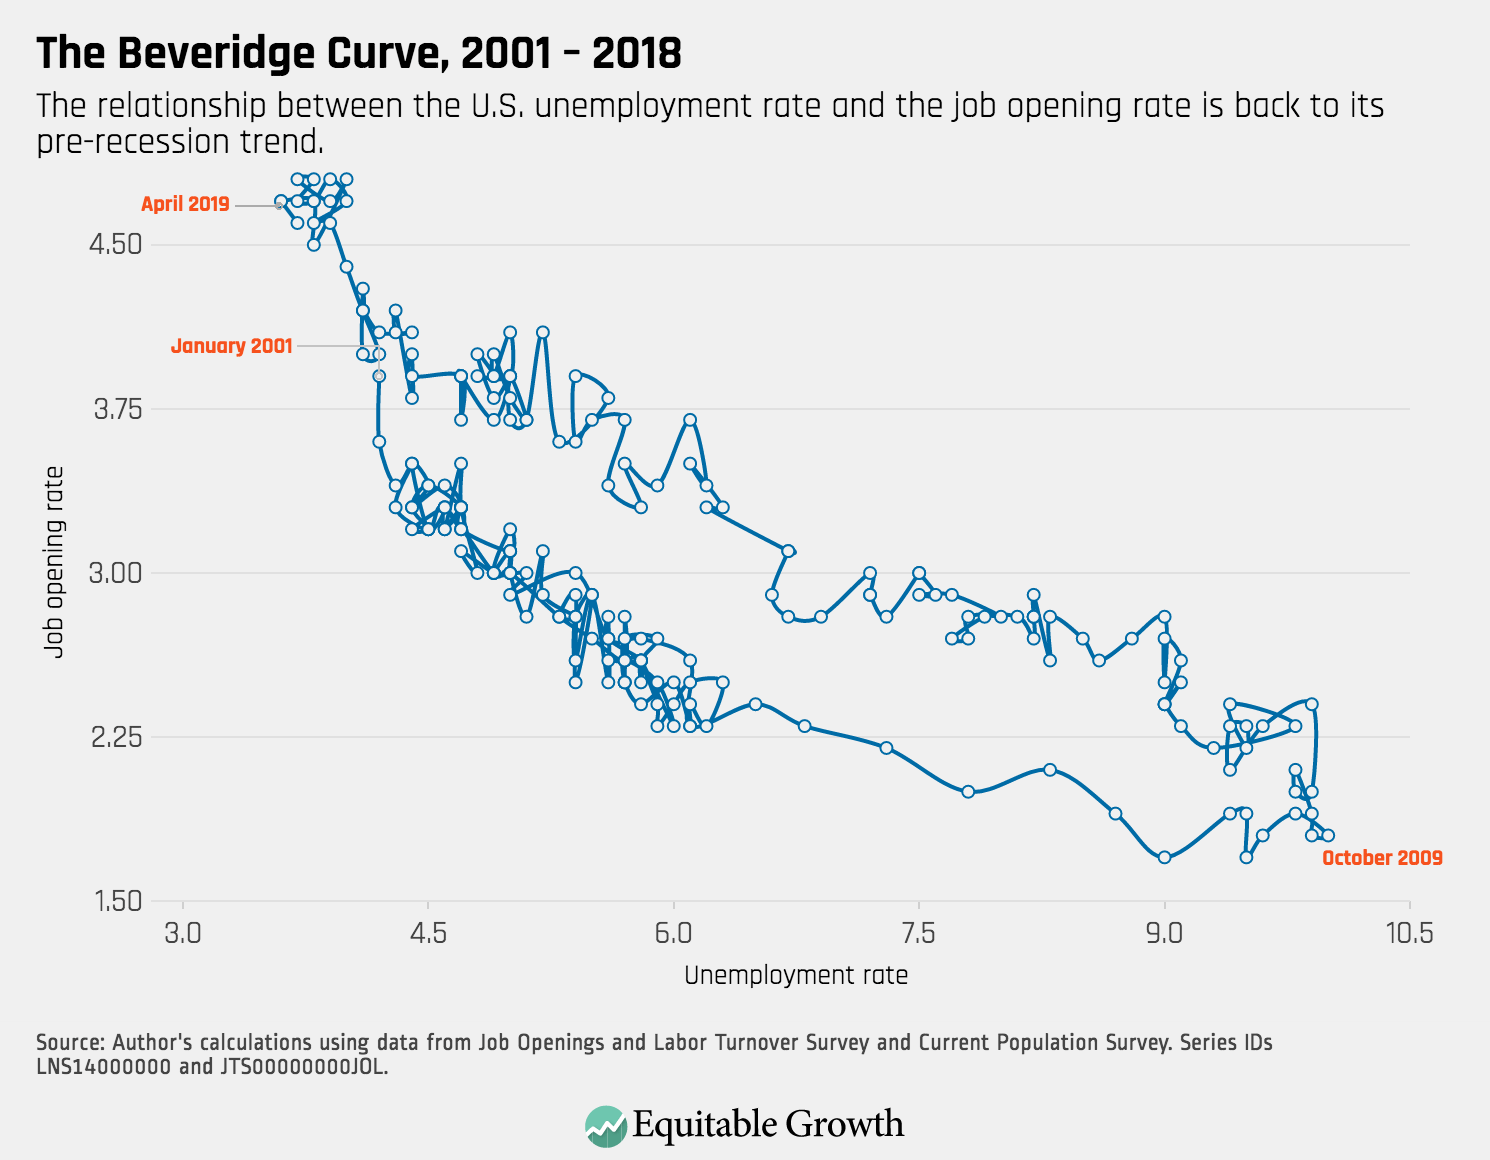
4.
Despite a slight increase in unemployment and a slight decrease in the job openings rate, the Beveridge Curve reflects an expansionary labor market.