JOLTS Day Graphs: July 2018 Report Edition
Every month the U.S. Bureau of Labor Statistics releases data on hiring, firing, and other labor market flows from the Job Openings and Labor Turnover Survey, better known as JOLTS. Today, the BLS released the latest data for July 2018. This report doesn’t get as much attention as the monthly Employment Situation Report, but it contains useful information about the state of the U.S. labor market. Below are a few key graphs using data from the report.
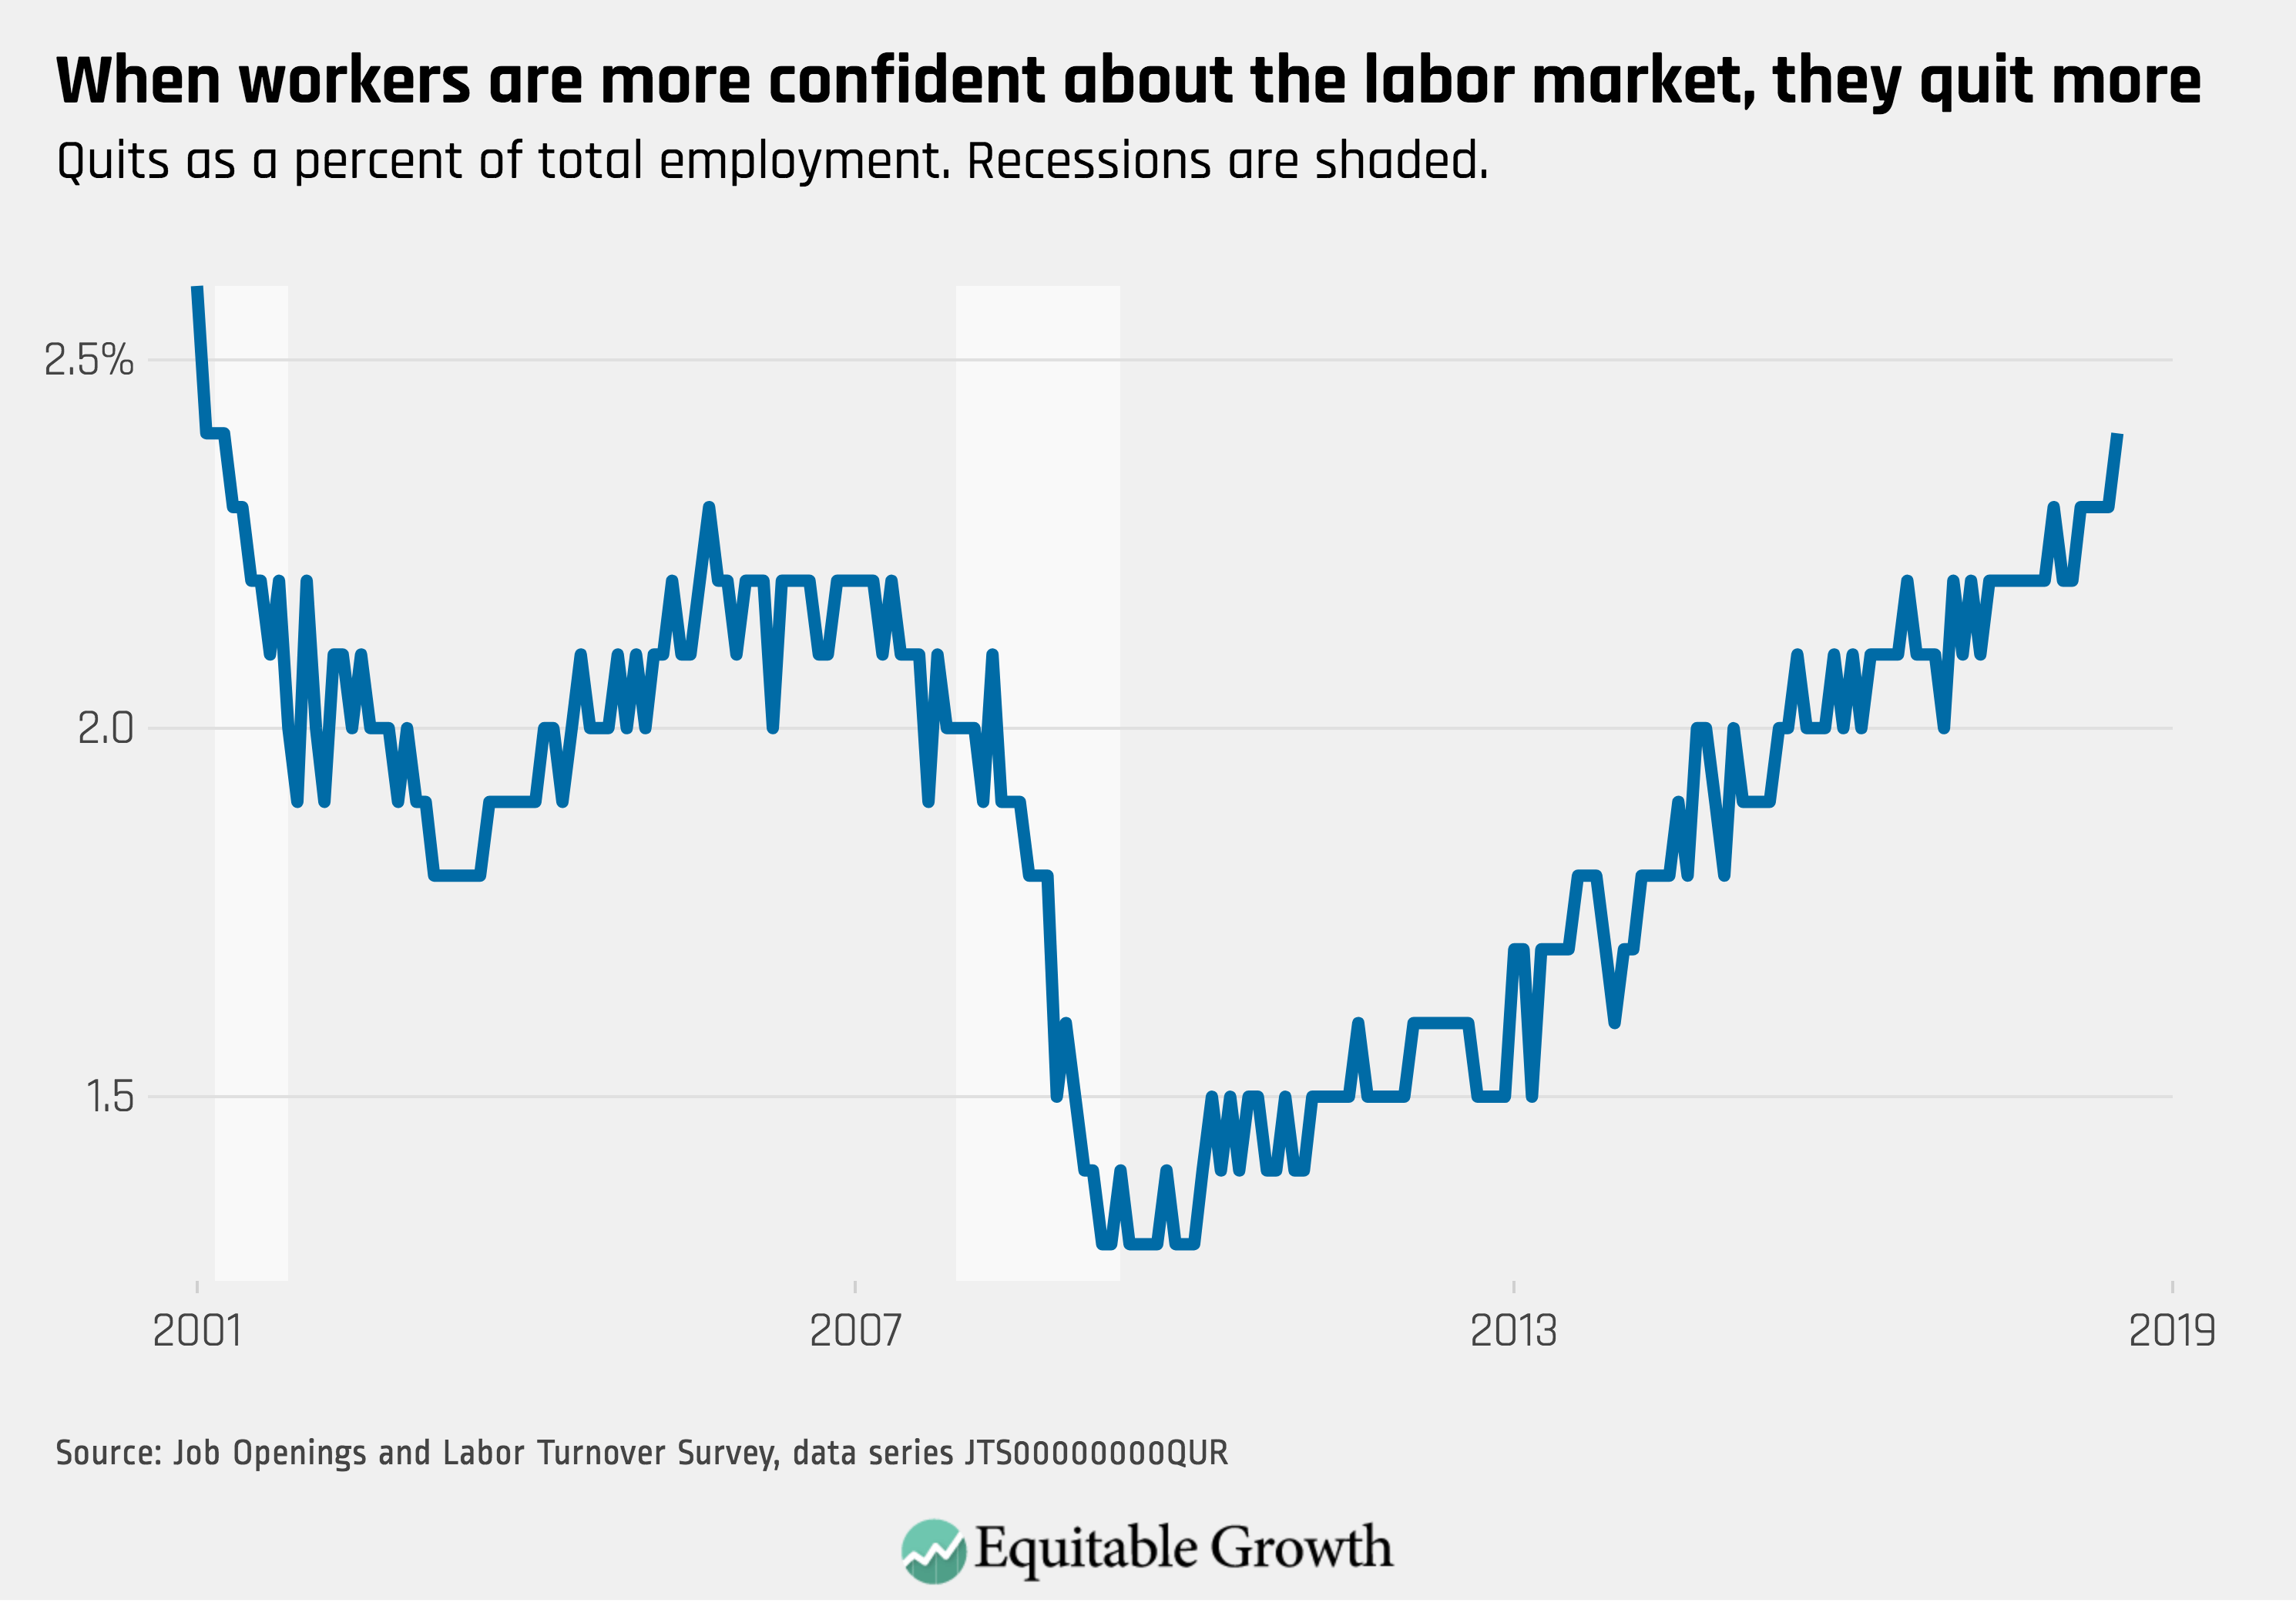
1.
The quit rate increased slightly for July, continuing its historical upward trend in a tightening labor market.
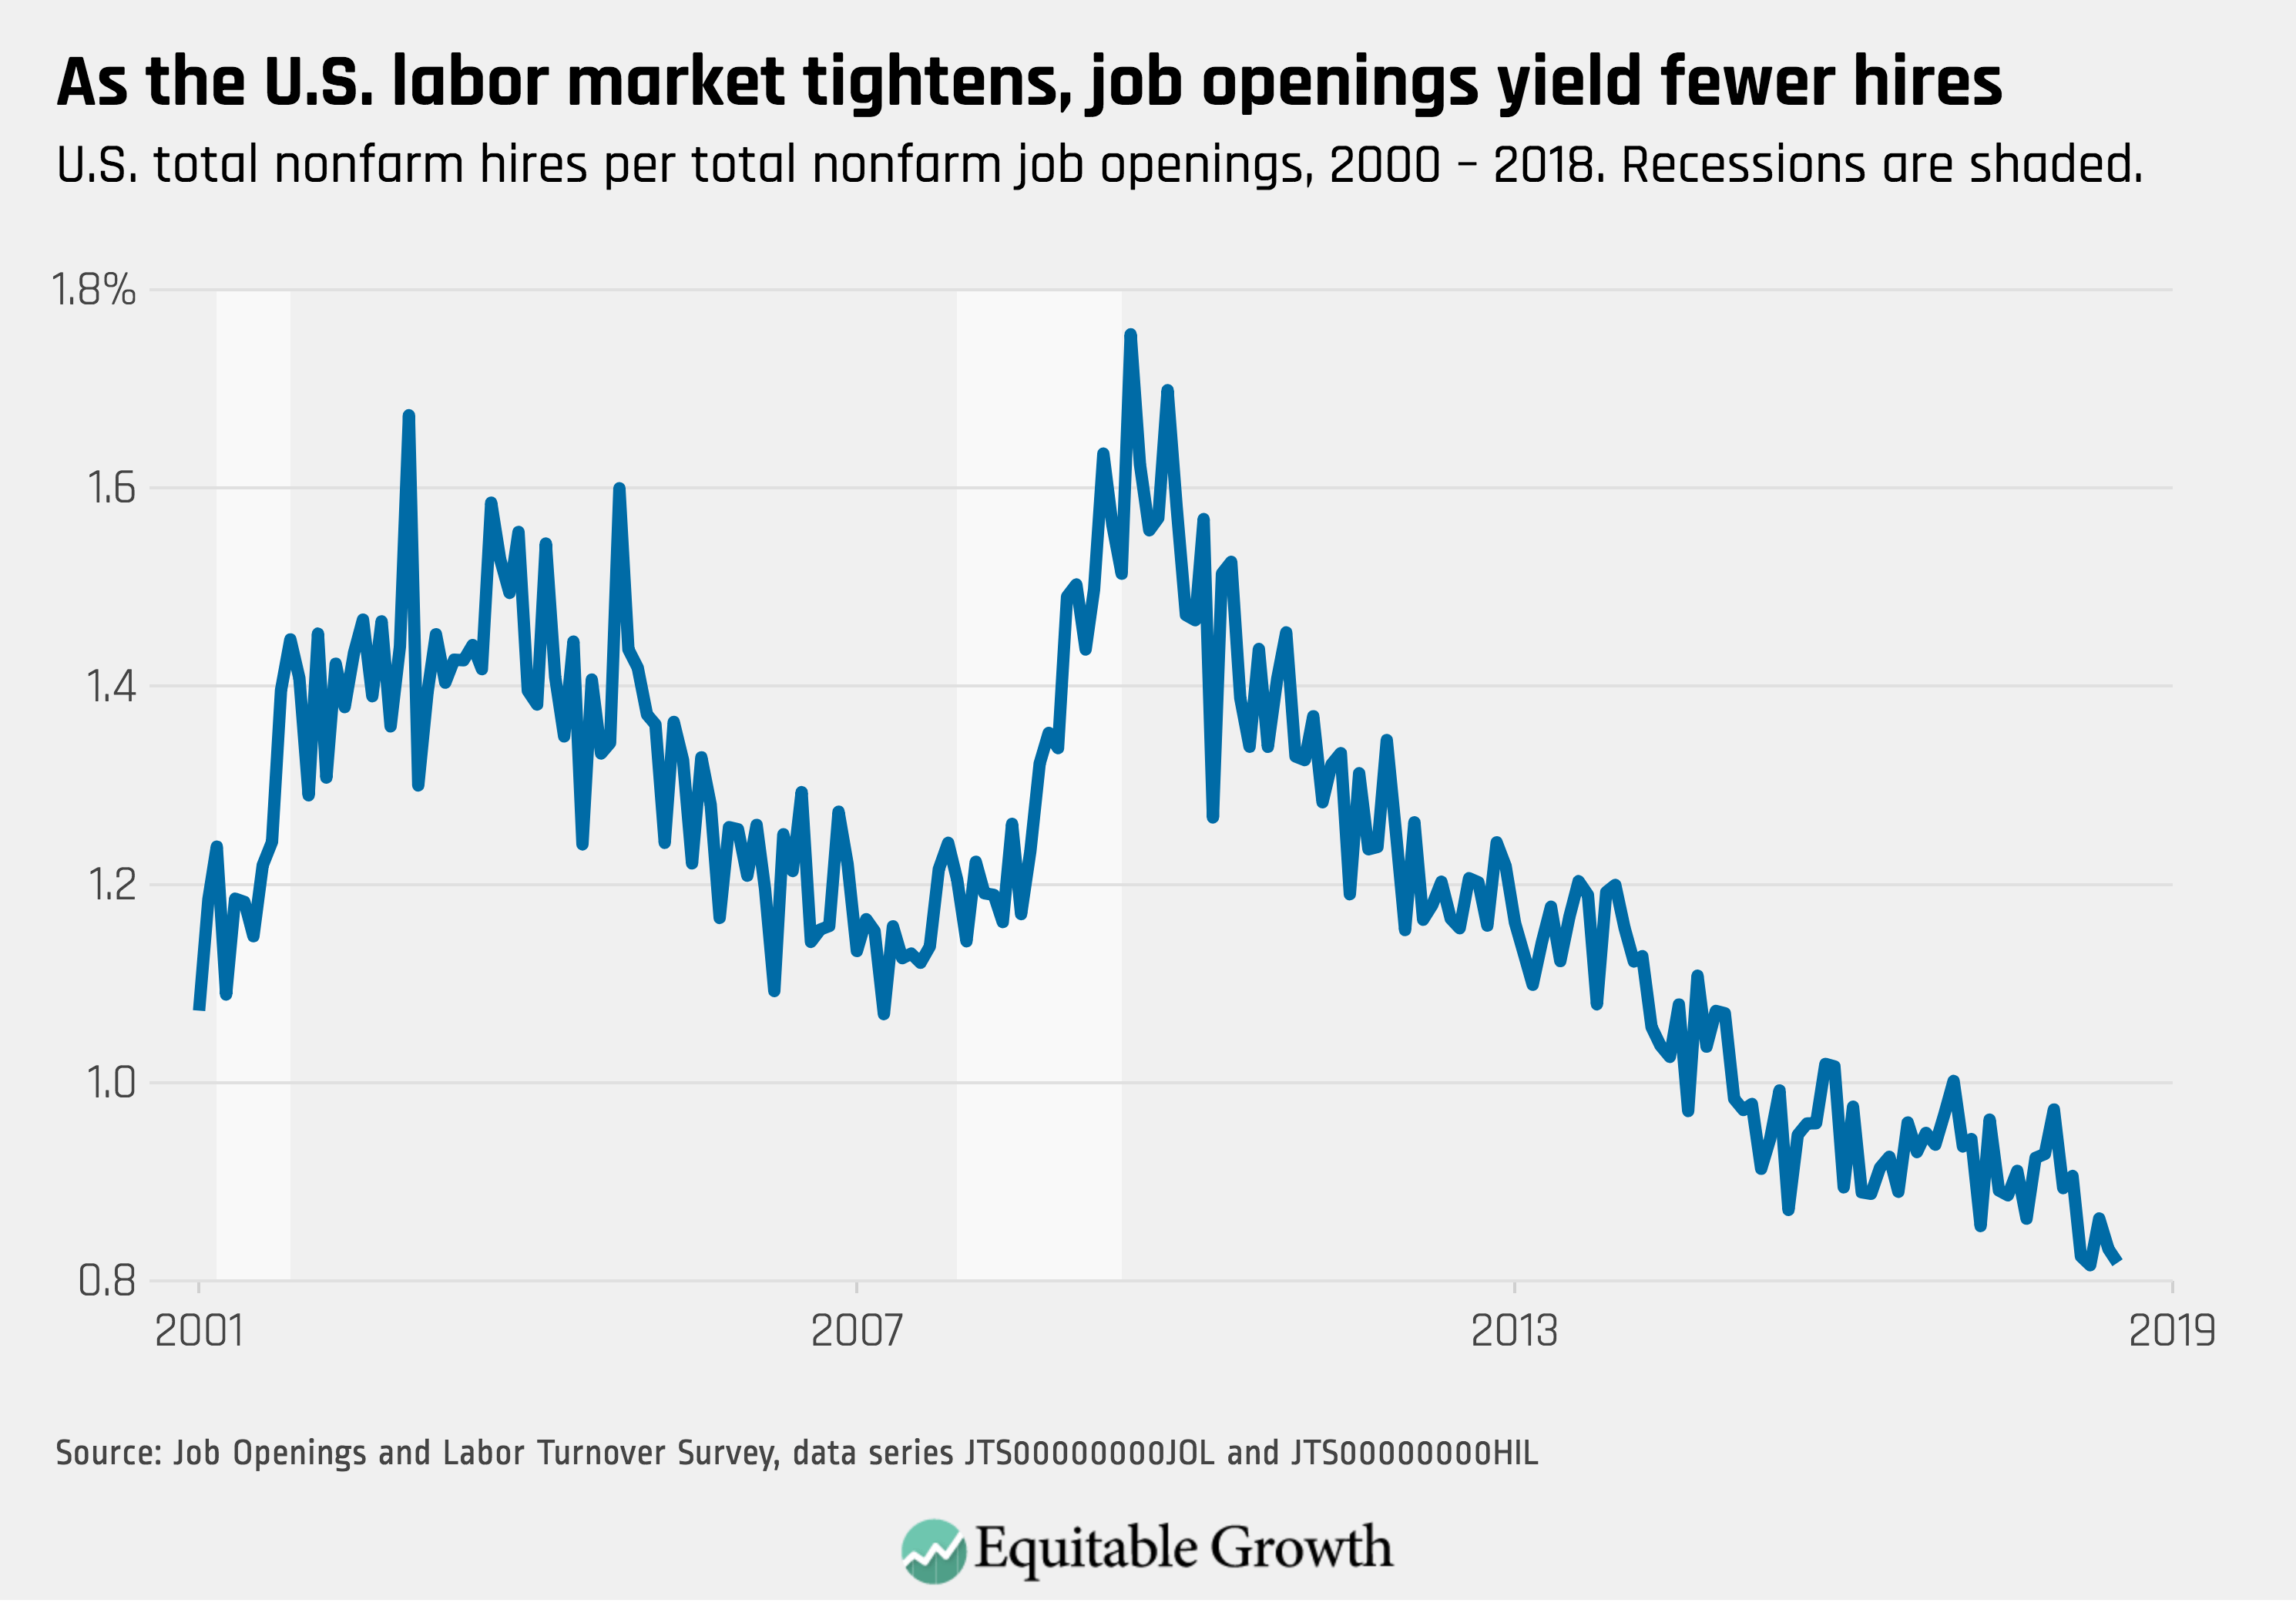
2.
The vacancy yield keeps trending downward, with a further fall from 0.83 in June to 0.82 in July.
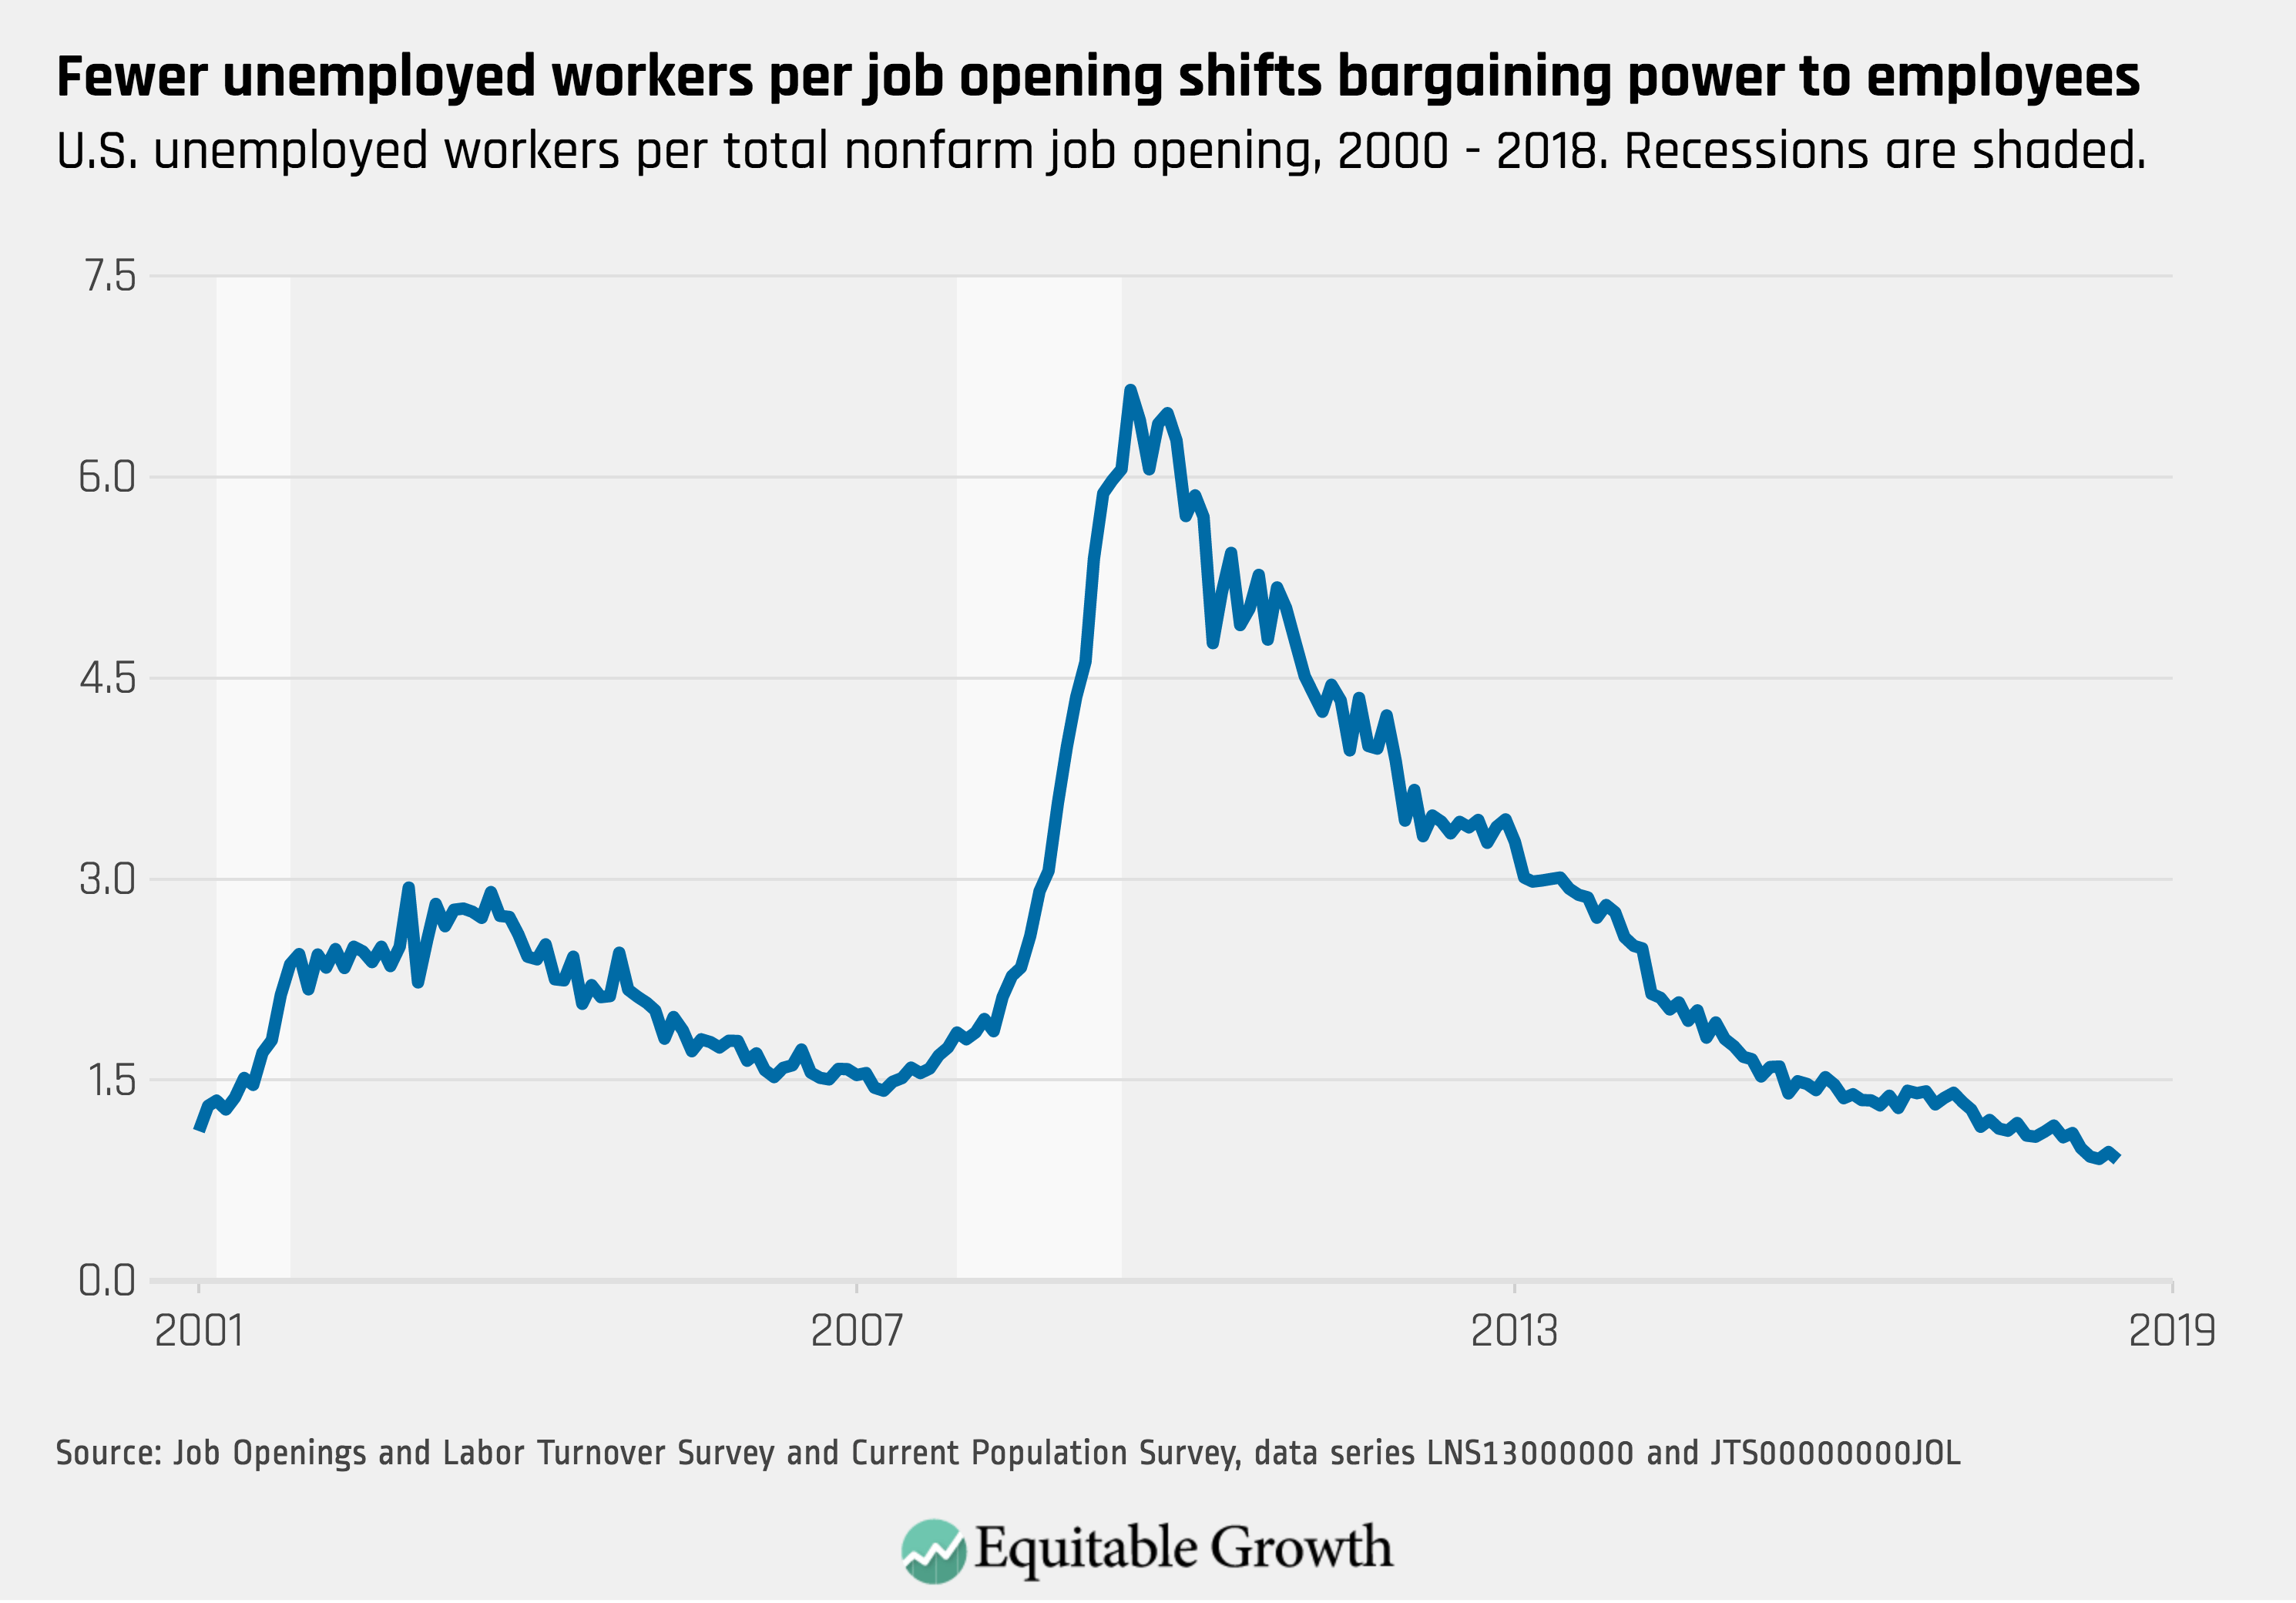
3.
The unemployment-per-job openings ratio decreased to 0.9
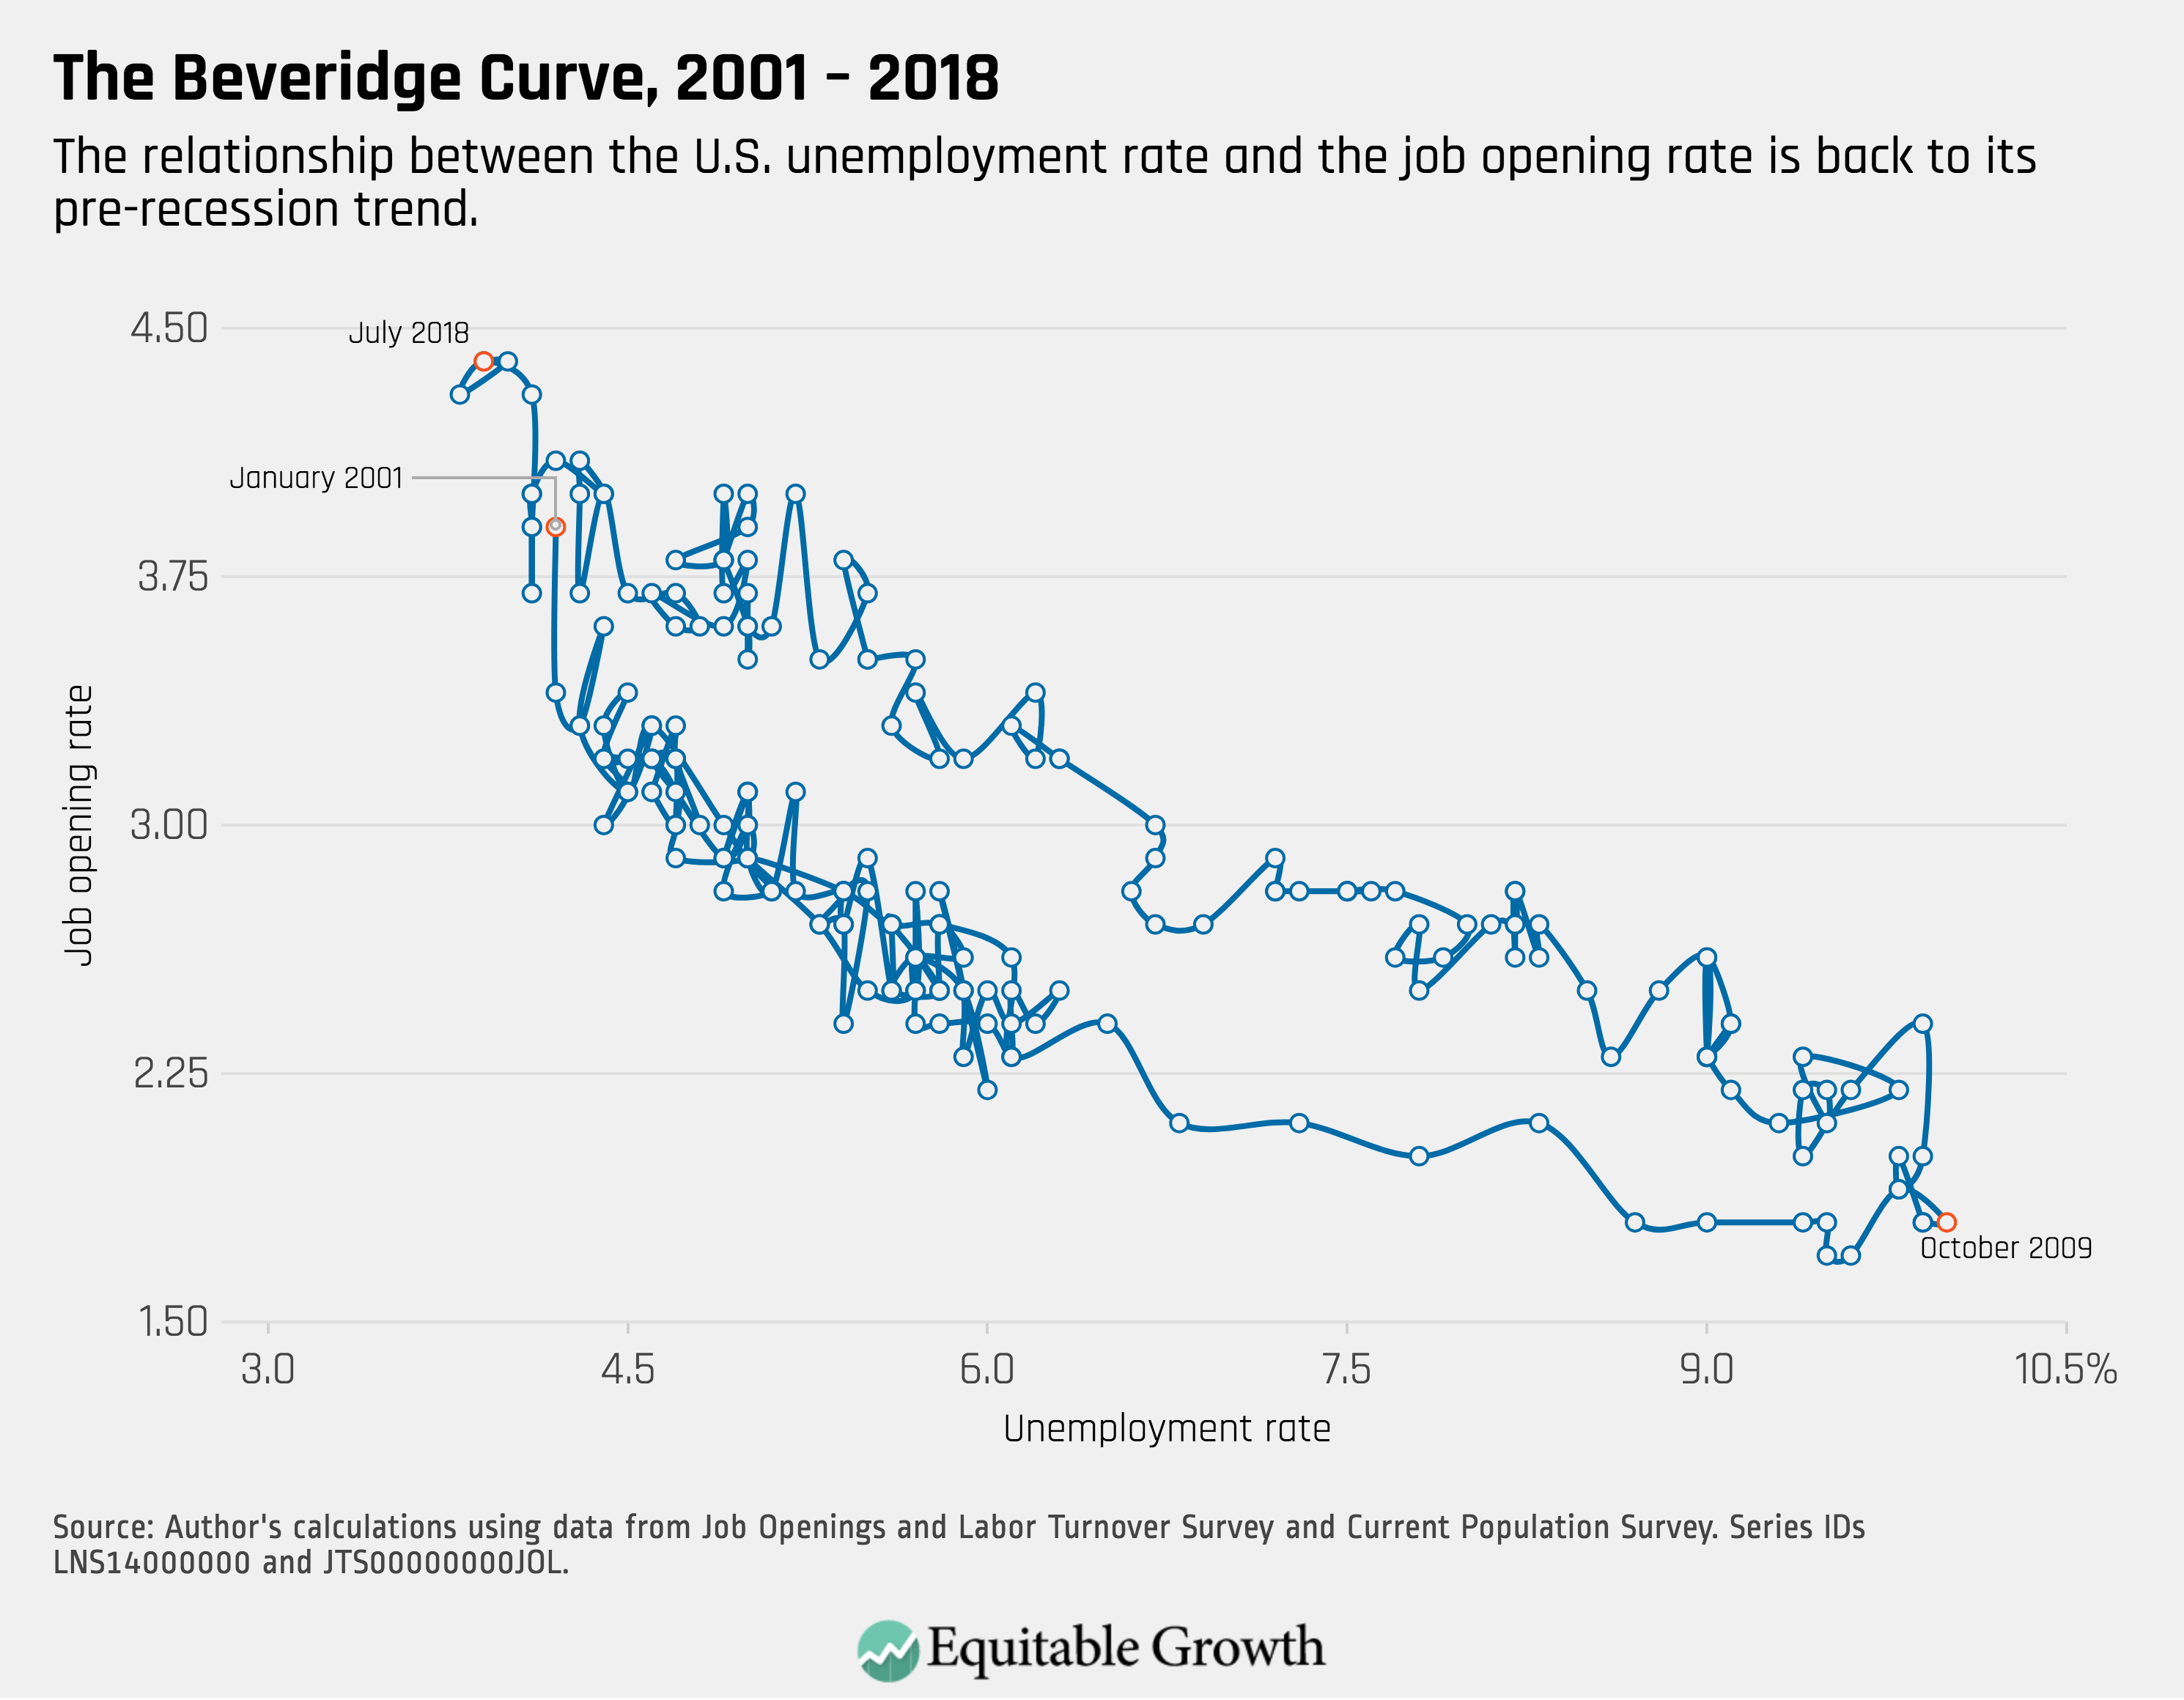
4.
The Beveridge Curve maintains its levels near those last seen during the expansion of the early 2000s.