JOLTS Day Graphs: April 2021 Edition
The quits rate reached a series high of 2.7 percent as nearly 4 million workers quit their jobs in April.

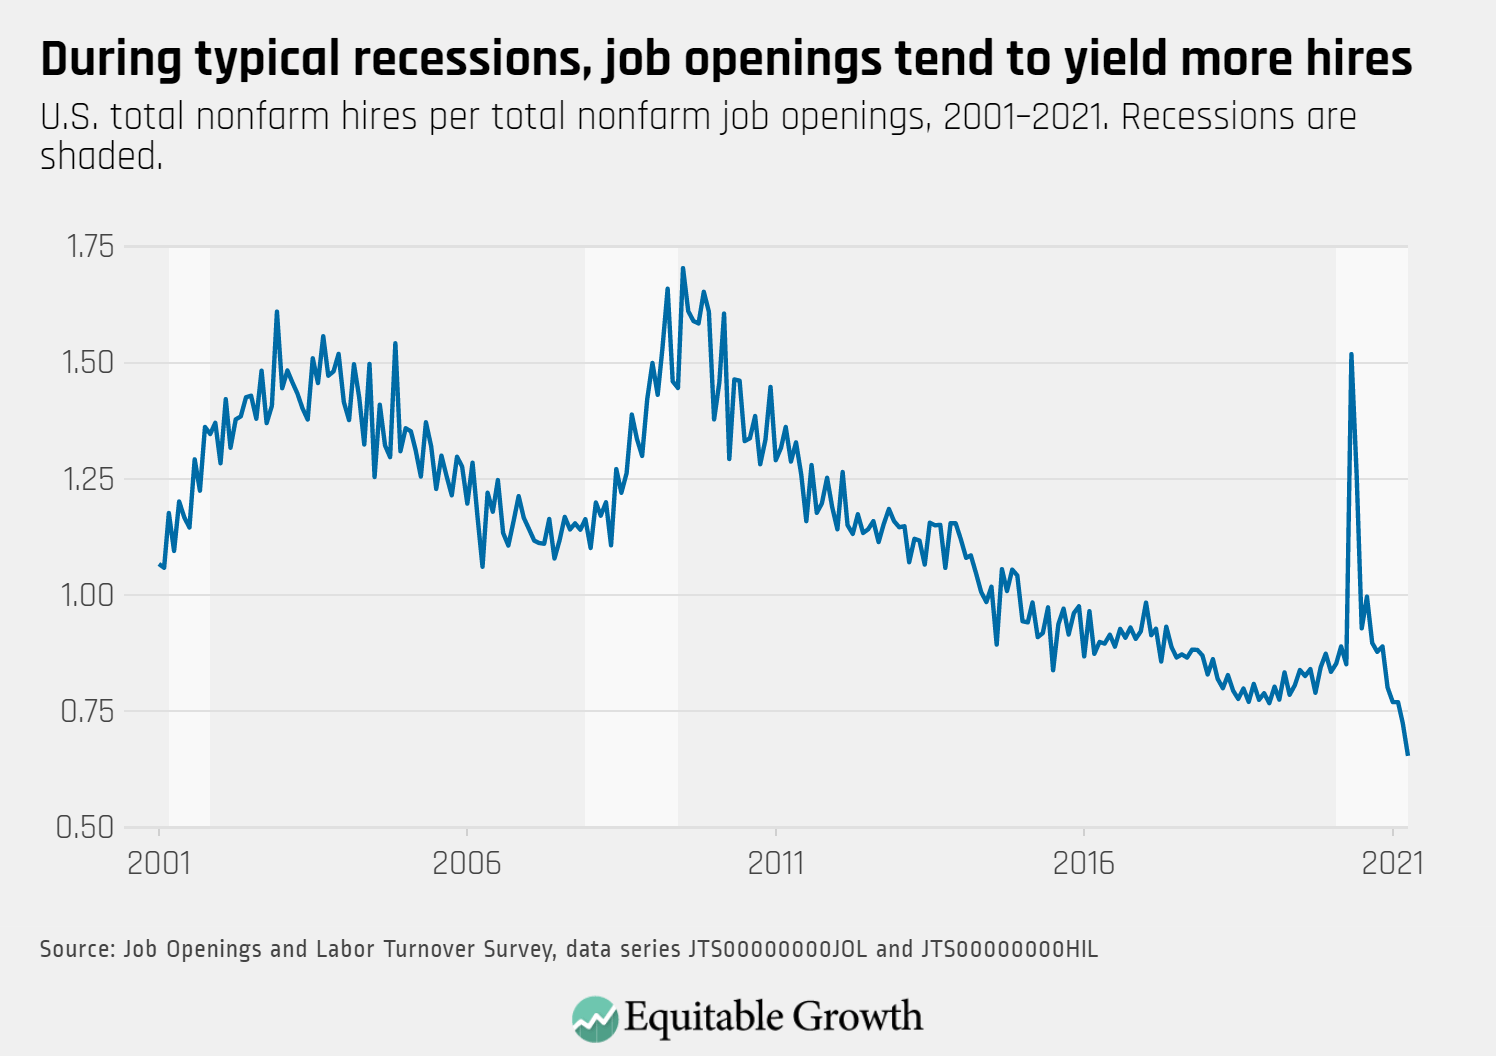
As job openings reached a series high of 9.3 million and hires stayed constant, the vacancy yield declined in April.
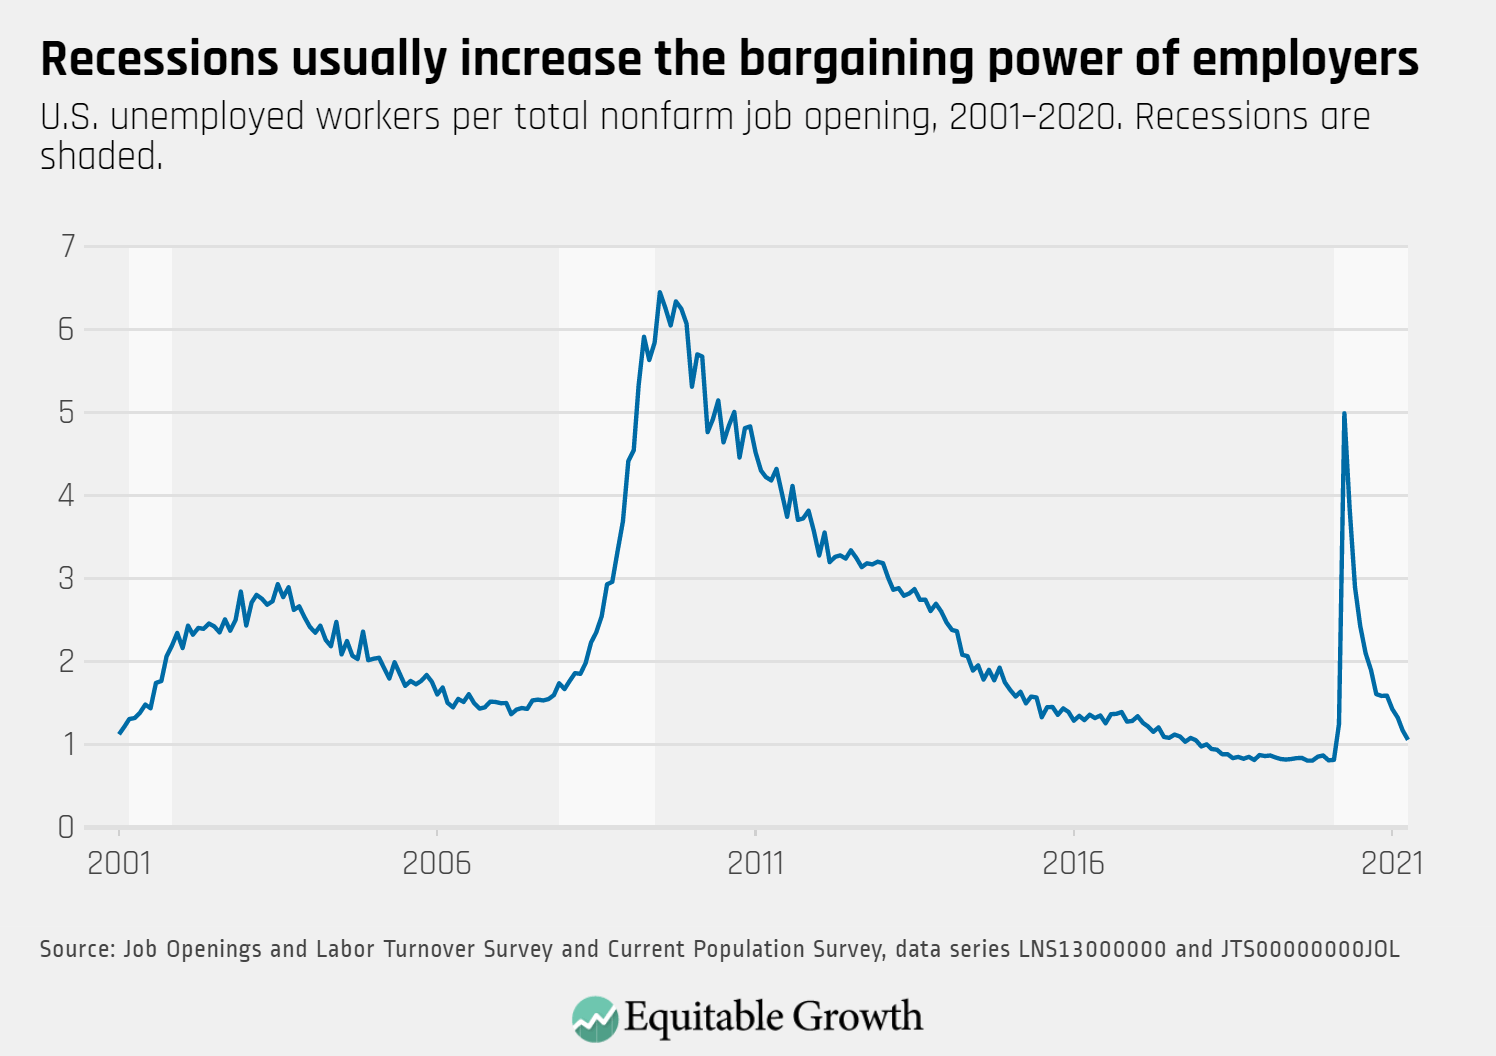
The ratio of unemployed-worker-per-job-opening was 1.06 in April, approaching its level of less than 1.0 prior to the recession.
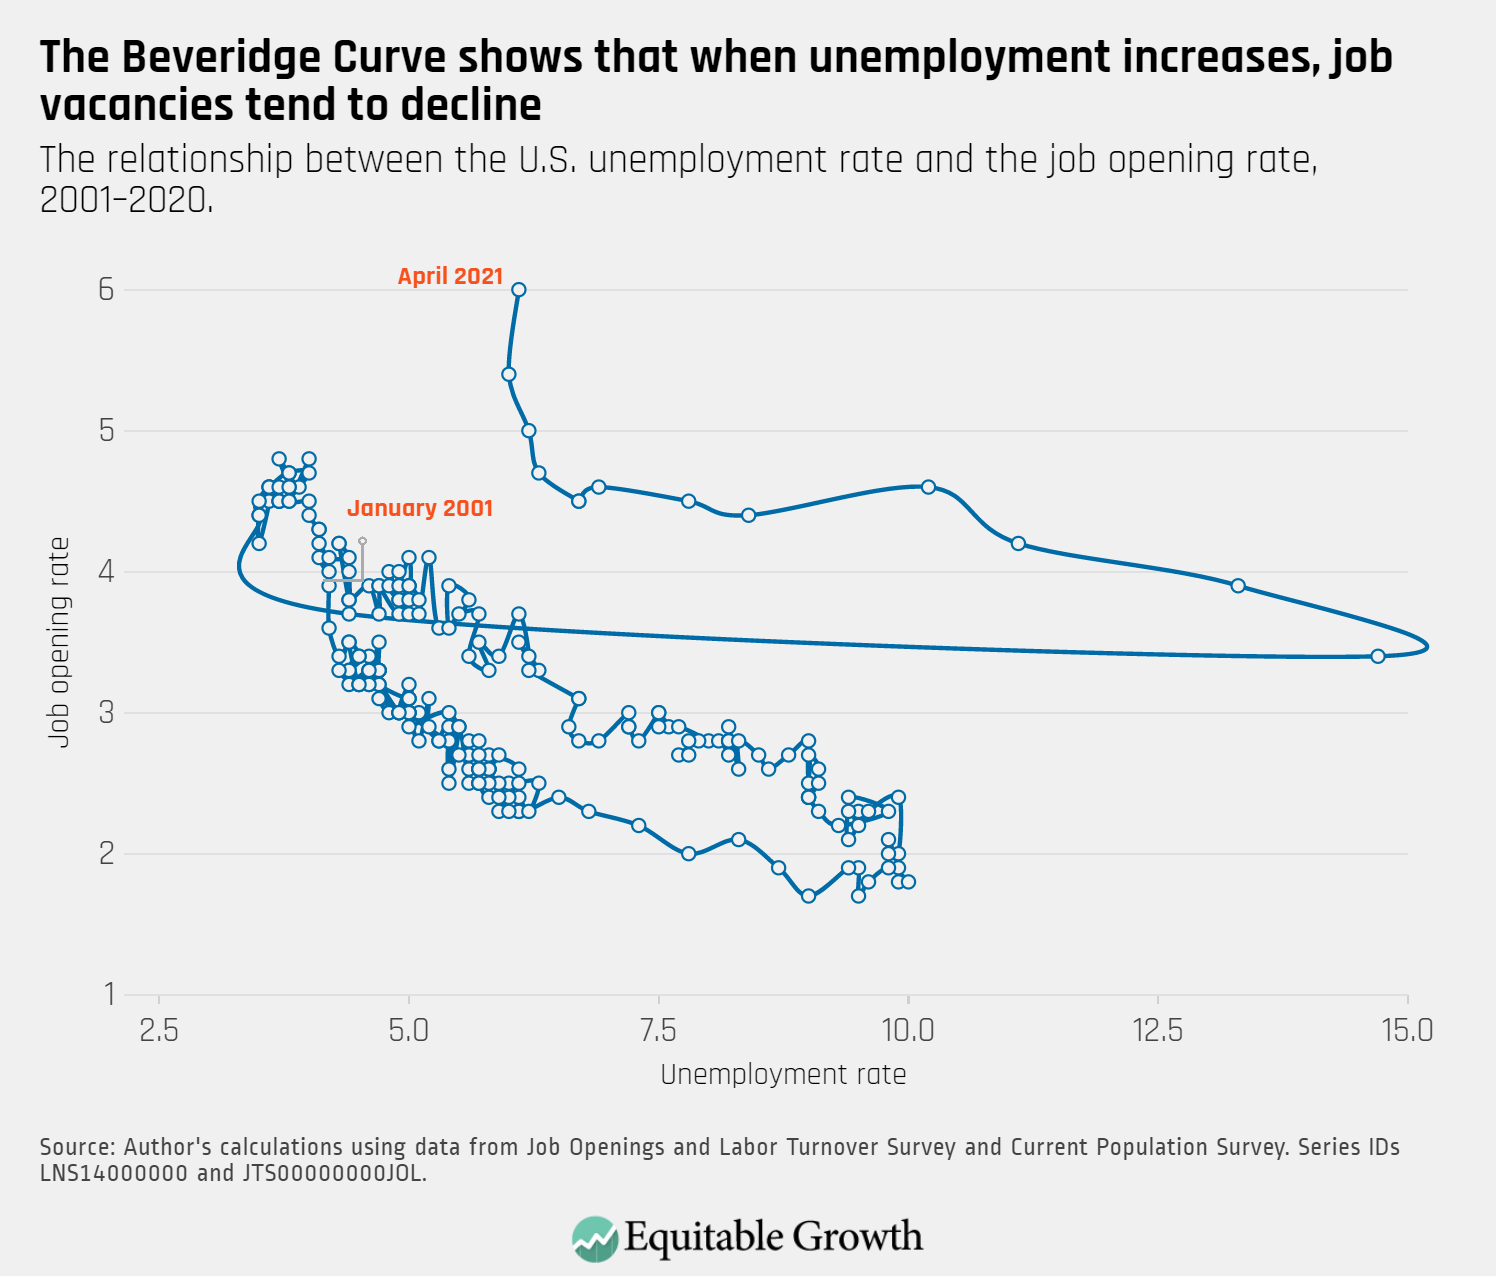
The Beveridge Curve moved sharply upwards with the historic level of job openings and continued to be in unprecedented territory compared to previous business cycles.