Analyzing recent U.S. economic policies using Equitable Growth’s Inequality Tracker
Key takeaways:
- The Washington Center for Equitable Growth’s Inequality Tracker uses trusted government data sources to create several windows into income and wealth inequality in the U.S. economy.
- The tracker subdivides both income and wealth by type, allowing users to explore how components of income or wealth have contributed to trends in the economy.
- Limiting the tracker to discrete economic eras of the United States, such as a business expansion or contraction, can explain which parts of the economy drove growth over that period.
- The tracker allows users to explore different groups so they can disambiguate whether changes in wealth or income were broad-based or particular to a section of the distribution.
Overview
The Washington Center for Equitable Growth’s Inequality Tracker is a data visualization tool designed to help policymakers and economic analysts examine and analyze U.S. income and wealth inequality in the 21st century. The Inequality Tracker is a flexible tool for exploring recent U.S. economic trends such as the recovery from the Great Recession of 2007–2009, the increasing share of transfers in income, and the lagging fortunes of the upper-middle class.
In this column, I will detail some useful lenses for analyzing the U.S. economy and recent economic policies with the tracker, including:
- Thinking in components of income and wealth
- Analyzing across the business cycle
- Disaggregating groups to find the real winners
I will illustrate how the tracker helps with these approaches using graphics pulled directly from it, which you can get by pressing the download image button above each graph. You can also get the data for each graph that way, using the adjacent button.
Thinking in components of income and wealth
One of the most unique features of the Inequality Tracker is the ability to look at how components of income and wealth each contribute to the overall patterns in inequality over time. The first graph below, for example, shows the path of income growth for the ninth decile of households—the 80th to 90th percentile—over the full course of the dataset from 2000 to 2023. (See Figure 1.)
Figure 1
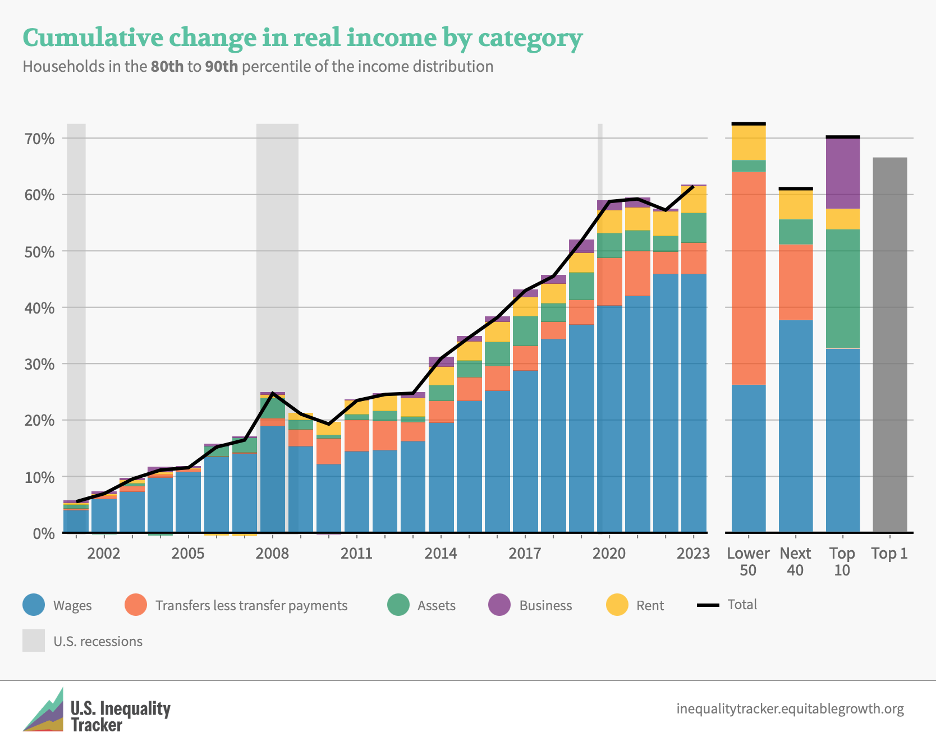
The ninth decile, and the three deciles below it, all experienced less income growth over these 23 years than U.S. households below them or above them. Why did this upper-middle segment of households fall behind in this period? Figure 1 shows that the vast majority of income growth for this group over this period came from growth in their wage incomes. Yet this does not indicate that this group had higher wage growth than other groups.
The second graph below shows the composition of income for the group selected and begins to shed some light on why the ninth decile fell behind. Here, we can see that wages make up about 80 percent of income for households in the ninth decile. (See Figure 2.)
Figure 2
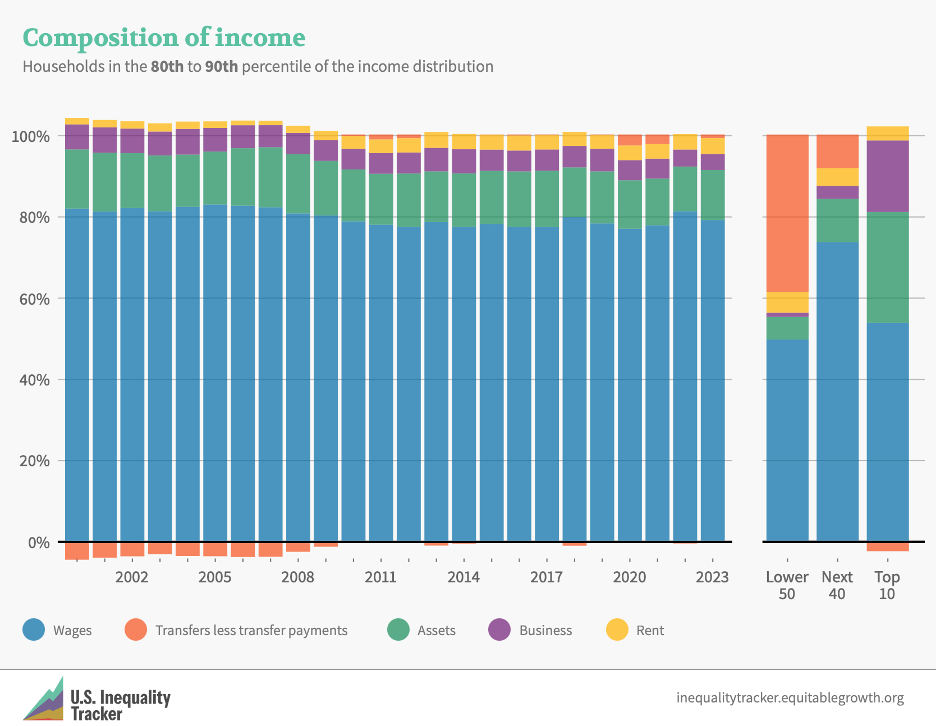
As Figure 2 shows, households in this decile received almost all their income from wages, so gains from wages over this period must have lagged gains in other components of income. But perhaps wages grew unevenly across the income distribution, and upper-middle class households missed out.
To check, we can look at the third graph below, which shows the compound annual growth rate in each component of income for the group selected and some comparison groups. So, for instance, Figure 3 shows that wages grew relatively evenly across the distribution of households but slower than other components of income. (See Figure 3.)
Figure 3
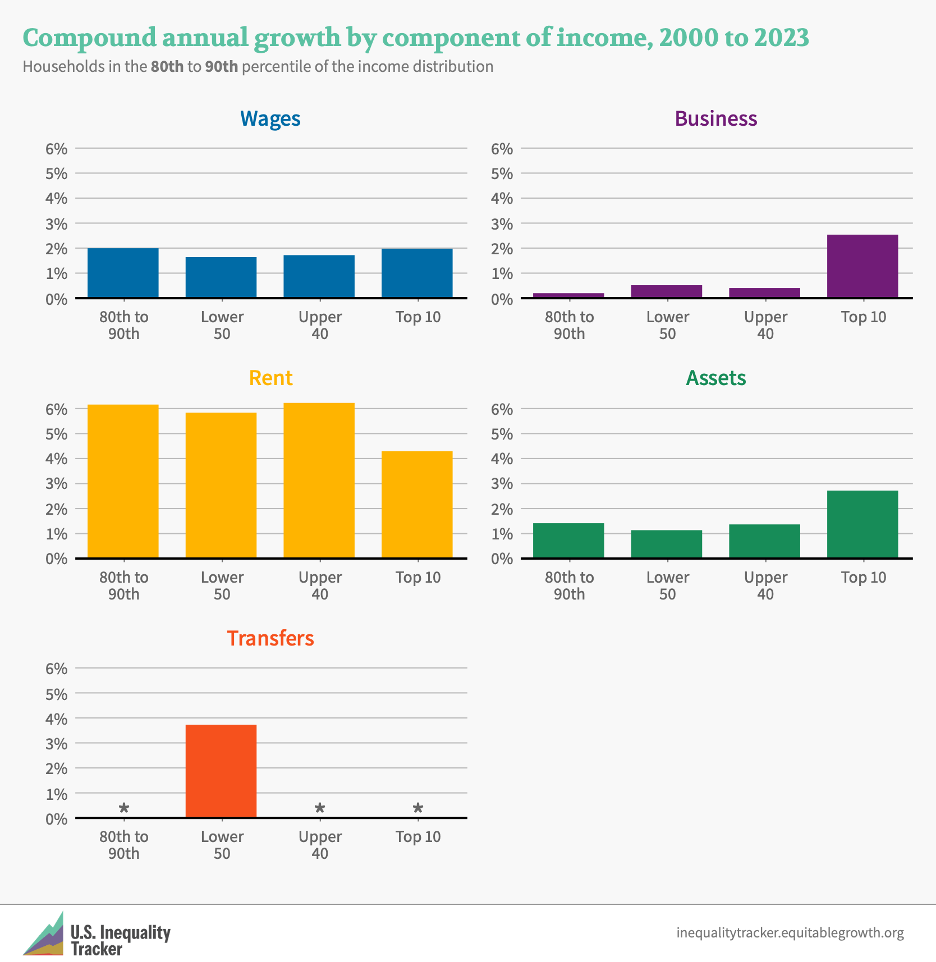
Together, these three graphs explain why the upper-middle deciles of the income distribution saw income gains 10 percentage points lower than the bottom 50 percent and the top 10 percent. This group is extremely dependent on one component of income—wages—that grew similarly across income brackets and grew slower than other components of income.
Analyzing across the business cycle
The example above looked at the entire time series available in the Inequality Tracker, from 2000 to 2023. But trends across smaller time periods also can help us evaluate specific policy regimes.
One narrative that was frequently debated during the economic expansion from 2009 to 2019 was the idea that the labor market should be run hot to shift the balance of bargaining power between workers and employers and generate wage gains for low- and middle-income workers. This narrative was especially prominent in the middle part of the 2010s, as slow wage gains produced an anemic recovery from the Great Recession of 2007–2009.
This policy program was pursued to some degree both by the Federal Reserve, which maintained a relatively dovish stance through this period, and by lawmakers in Congress and the Obama administration. Stimulus included implementation of the Affordable Care Act starting in 2014 and payroll tax cuts in 2011 and 2012. These policies and market conditions created a tight labor market: U.S. unemployment dropped to its lowest level in more than 40 years and prime-age labor force participation recovered to the level of the early 2000s.
Let’s look at this era of the U.S. economy, and specifically at what I call the middle 40 percent—households between the 30th and 70th percentile on the income distribution. This group fits my mental model of the middle class. They get more than 50 percent of their income from wages and are mostly households with more than $50,000 but less than $100,000 of total annual income. The graph below shows the evolution of this group’s income from the start of the Great Recession in 2007 to the end of the expansion in 2019. (See Figure 4.)
Figure 4
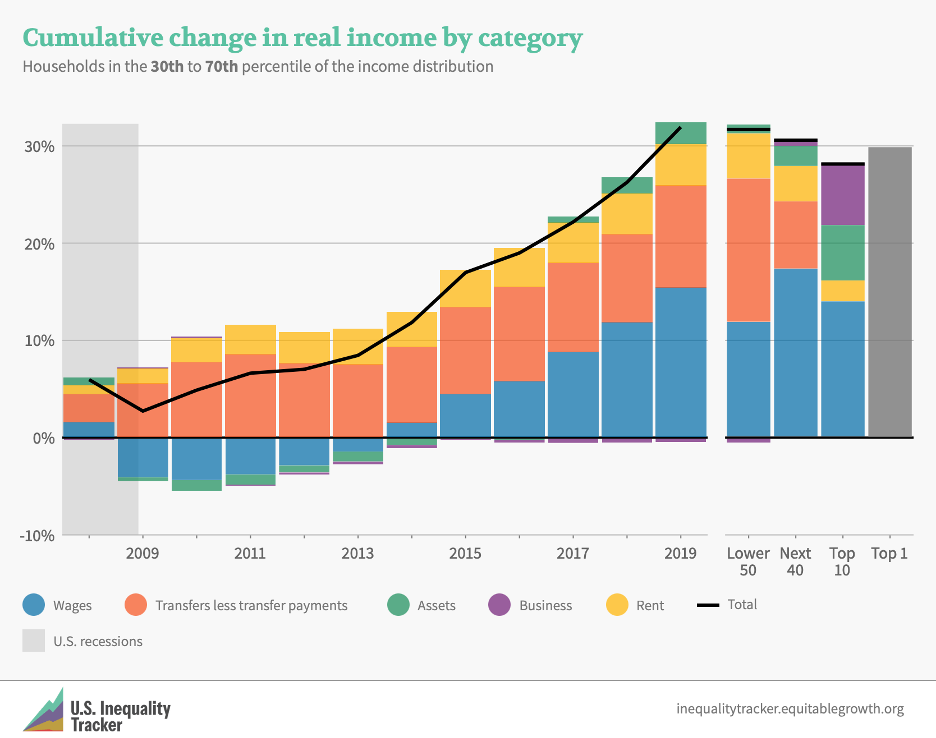
There are two distinct eras of wage recovery for this group. Wages dipped dramatically during the recession and did not recover to 2006 levels until 2014. From 2014 to 2019, however, wages grew relatively quickly.
Next, we can look at the compound annual growth rate graph to get a sense of how wage growth in this period compares across the income distribution. Wages for the middle 40 percent group grew at an annual rate of about 3.7 percent in this time span, faster than comparison groups, although these groups also saw strong growth. (See Figure 5.)
Figure 5
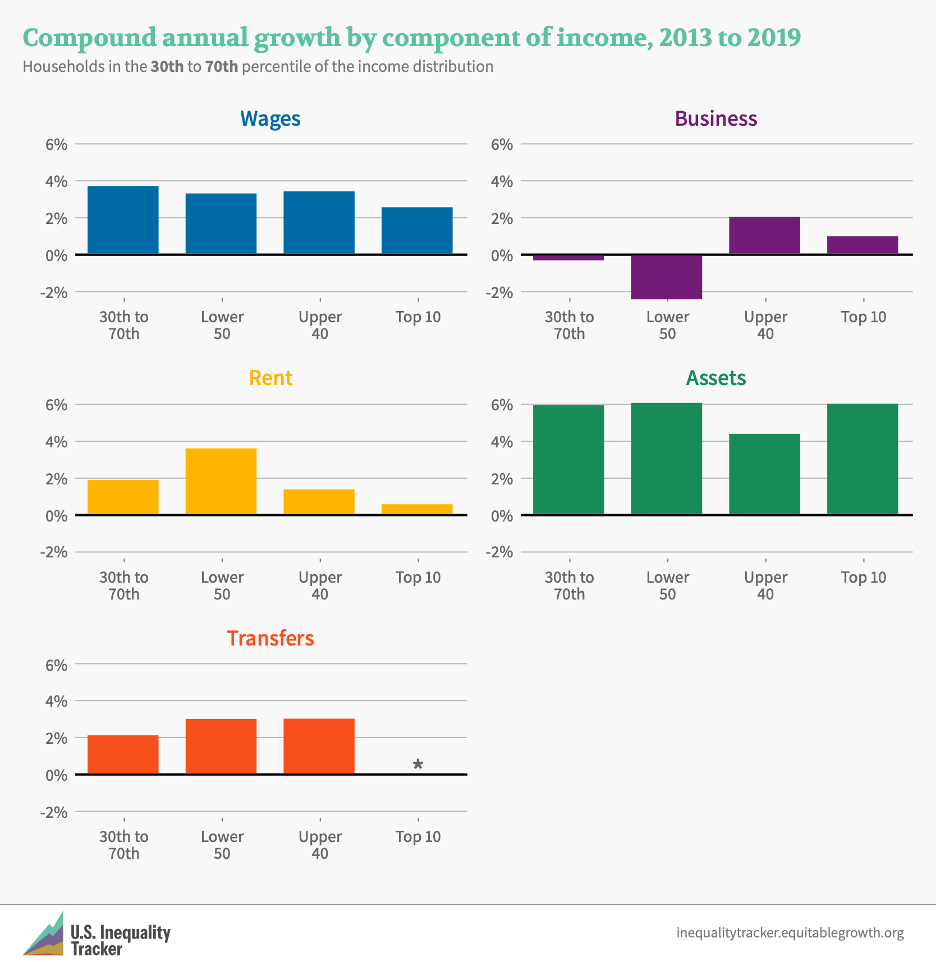
Remember from the first example above that 3.6 percent is a much faster rate of wage growth than what was common over the entire period from 2000 to 2023, where no U.S. households saw more than 2 percent annual wage growth. So, from this second analysis, it looks as though running the labor market hot was fairly successful at boosting wages, and especially so for households outside the top 10 percent.
Did the hot labor market reduce inequality though? According to the next graph below, which shows the share of all income earned by the selected middle 40 percent group, this strong period of wage growth did not result in this group capturing significantly more of aggregate income. Indeed, from 2013 to 2019, this group’s share of aggregate income fluctuated very slightly, between 27.3 percent and 27.7 percent of all income. (See Figure 6.)
Figure 6
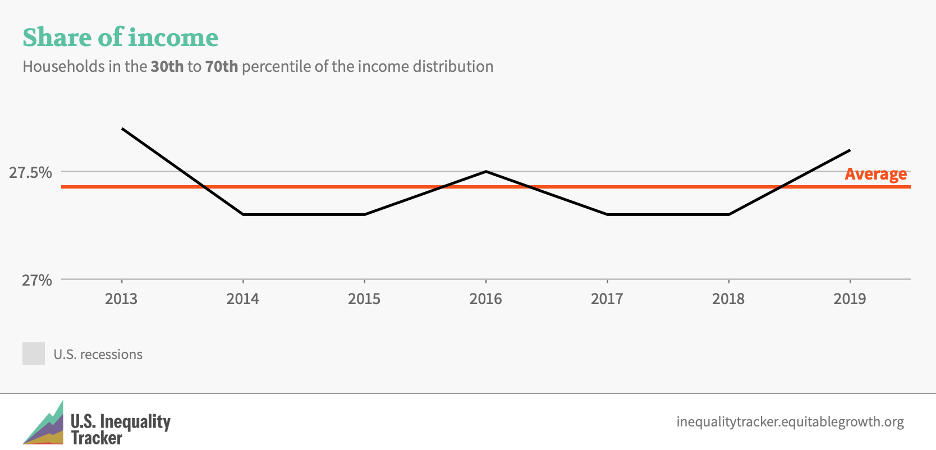
That’s the brutal math of inequality: Meaningful shifts in the distribution of income require large and sustained shifts in income growth.
Disaggregating groups to find the real winners
So far, we have looked at broad groups of households in the income distribution. Many households that are close in the distribution have similar outcomes in the U.S. economy, but the Inequality Tracker provides ample opportunities to disaggregate and look for exceptions.
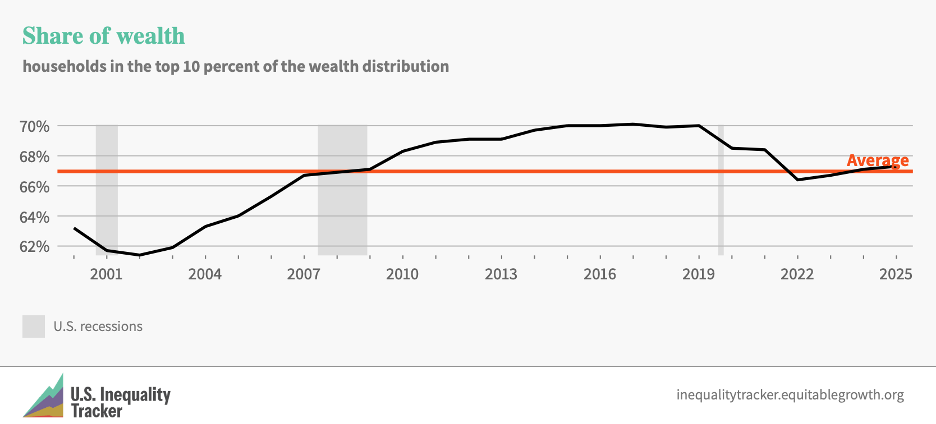
Let’s briefly consider the distribution of wealth in the United States. Between 2000 and 2025, the share of all wealth earned by the top 10 percent of U.S. households in the distribution rose through about 2016, then declined through the COVID-19 pandemic of 2020–2023 before recovering somewhat in recent years. (See Figure 7.)
Figure 7
The Distributional Financial Accounts—data that we use to create the wealth side of the Inequality Tracker—allows us to further disaggregate this top 10 percent group, which shows that there is actually considerable heterogeneity within the group. The 90th to 99th percentile of households follow a similar pattern as the top 10 percent through about 2010. After that, the two groups diverge. This group’s wealth as a share of total wealth has declined consistently since 2010. (See Figure 8.)
Figure 8
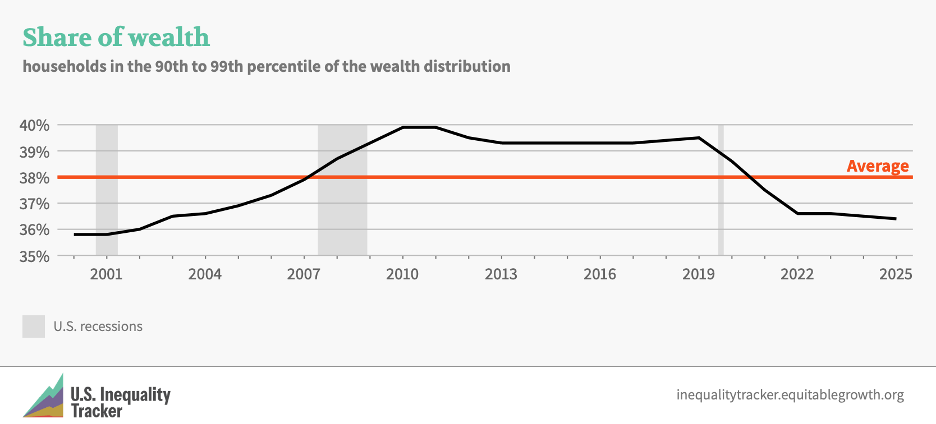
The only possibility to explain this discrepancy is that the top 1 percent of households is pulling away from the next 9 percent. Figure 9 verifies that top 1 percent’s wealth has continued increasing as a share of total wealth, with a slight dip around the time of the COVID-19 pandemic. (See Figure 9.)
Figure 9
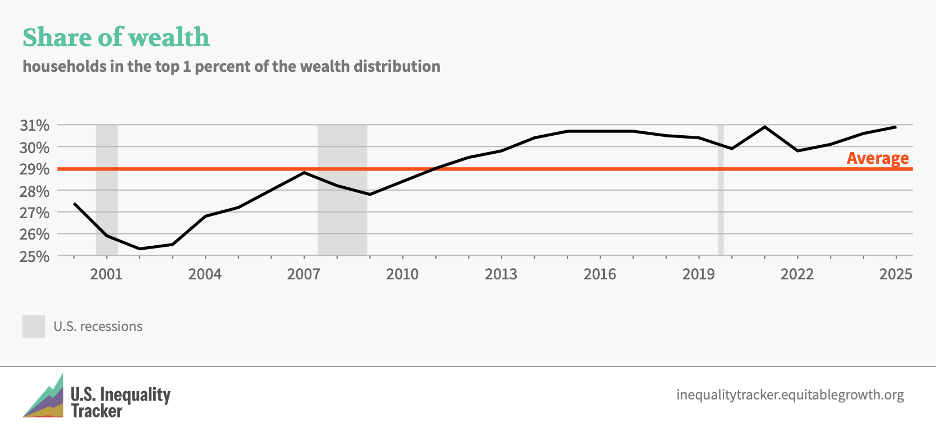
Further exploration with the Inequality Tracker shows that this trend is attributable in large part to the higher share of equities in the wealth of the top 1 percent of households and high growth in equity wealth for that group compared to others.
Conclusion
The Federal Reserve’s Distributional Financial Accounts and the U.S. Bureau of Economic Analysis’s Distribution of Personal Income data series are important new tools for understanding the U.S. economy. Equitable Growth’s Inequality Tracker provides windows onto the data that you can use to think about how inequality is changing in the United States, how a component of wealth or income is performing relative to other components, how the composition of wealth and income is changing over time, and more. You can do even more by analyzing the official data yourself, but we hope the tracker will prove to be a useful jumping off point for developing intuition about the movement of income and wealth in the U.S. economy.
If you have questions about the data or need help analyzing data, we would love to help. Contact us at inequalitytracker@equitablegrowth.org.
Did you find this content informative and engaging?
Get updates and stay in tune with U.S. economic inequality and growth!


Stay updated on our latest research