JOLTS Day Graphs: December 2020 Edition
The quits rate increased slightly to 2.3 percent in December, with larger increases to the quits rate in leisure & hospitality and education & health services.

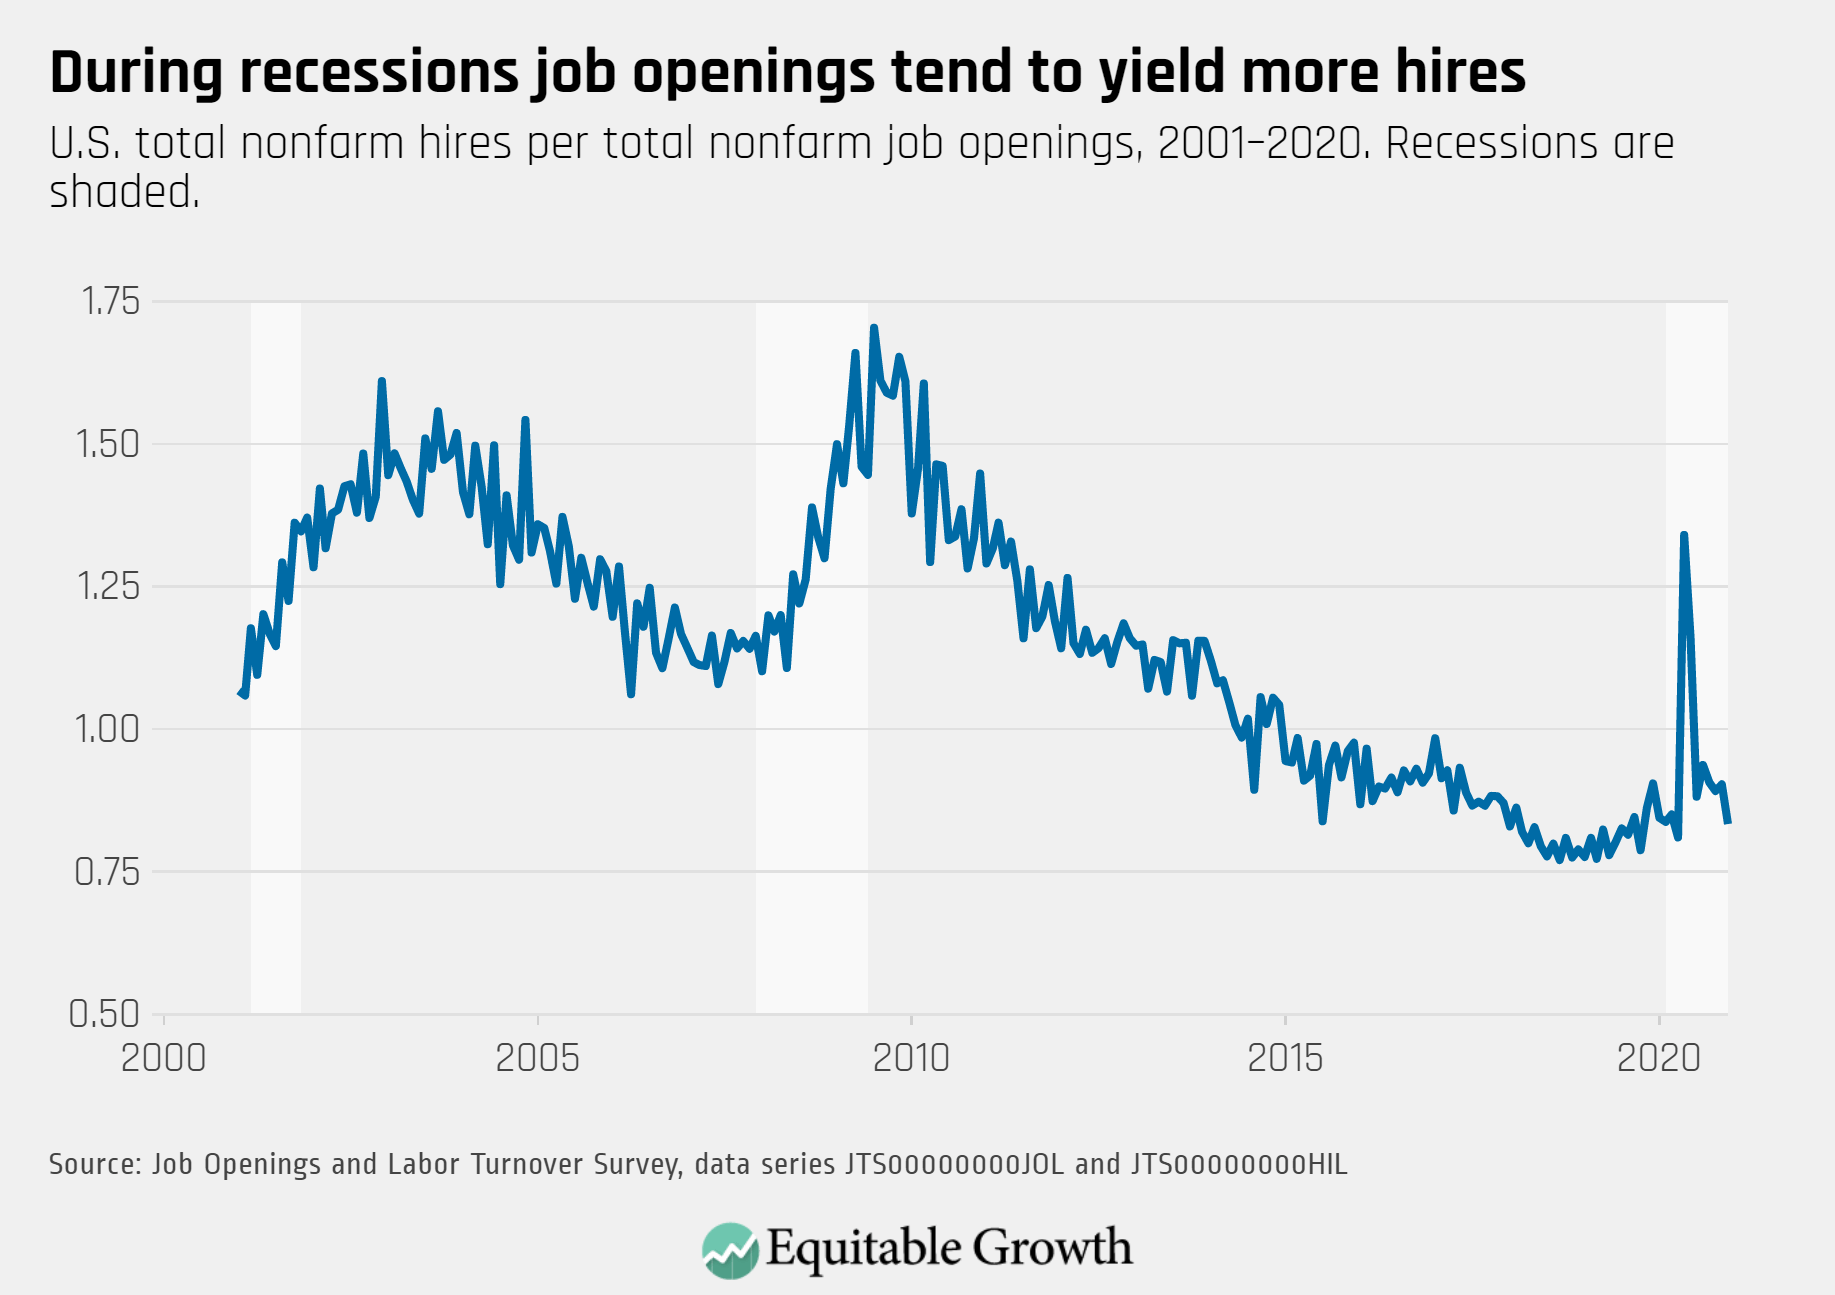
Job openings were little changed but hires decreased in December, leading to a decline in the job vacancy yield.
With little change to unemployment and openings in December, the ratio of unemployed workers remained stable, although at an an elevated level compared to before the pandemic.

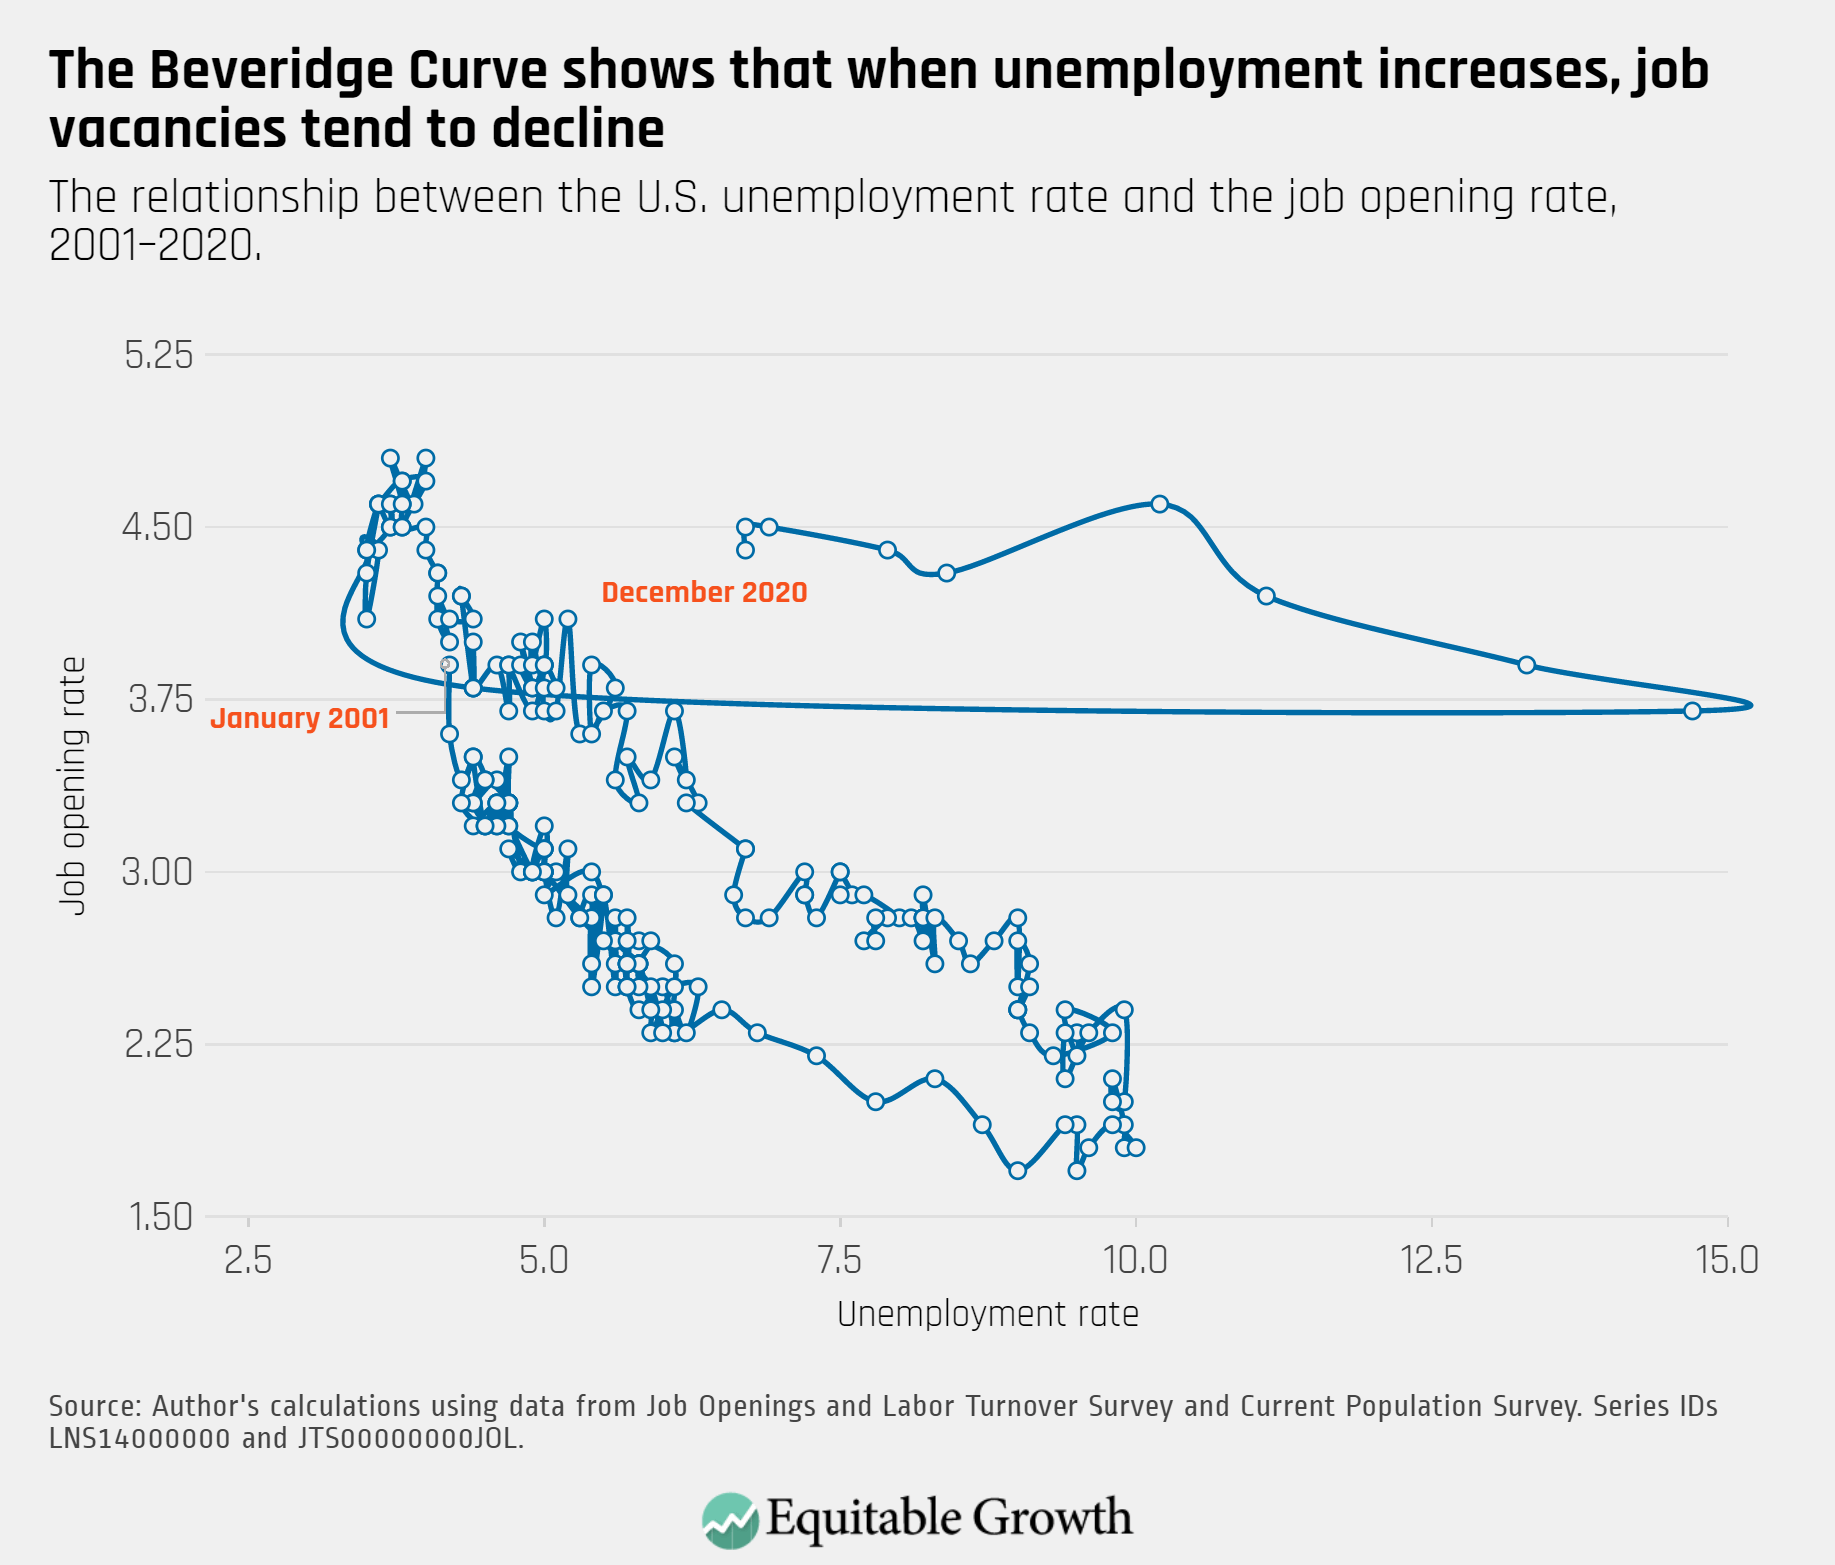
The Beveridge Curve has made little movement in the past three months, but remains in an atypical range during the pandemic-induced recession.