JOLTS Day Graphs: February 2020 Report Edition
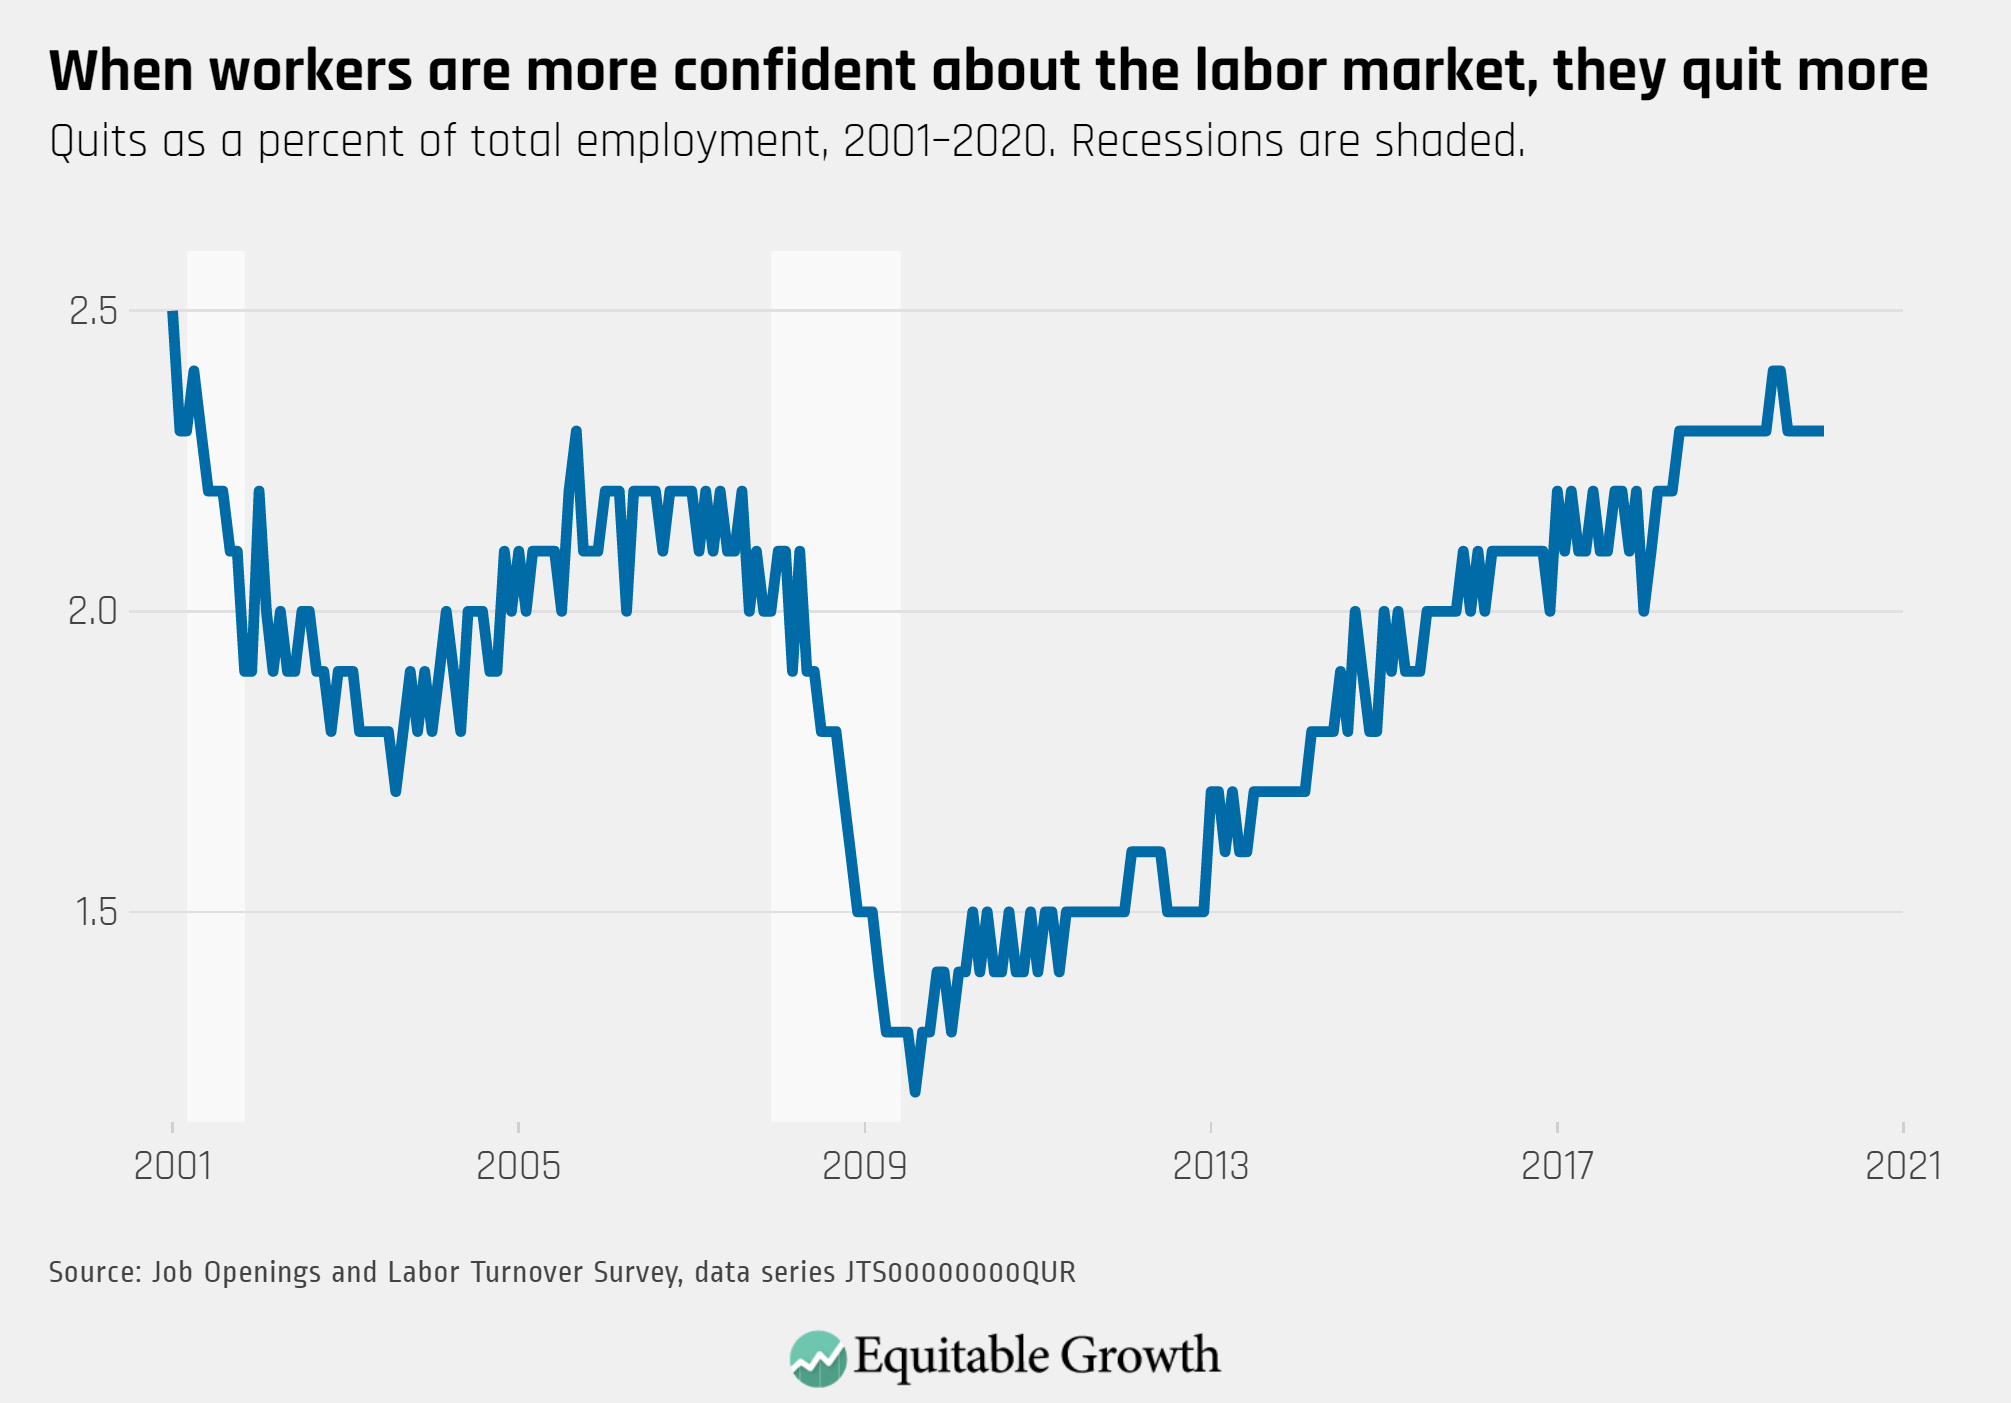
1.
Two months prior to social distancing measures, the quit rate remained steady at 2.3%, reflecting confidence about the labor market before the unexpected decline in economic activity.
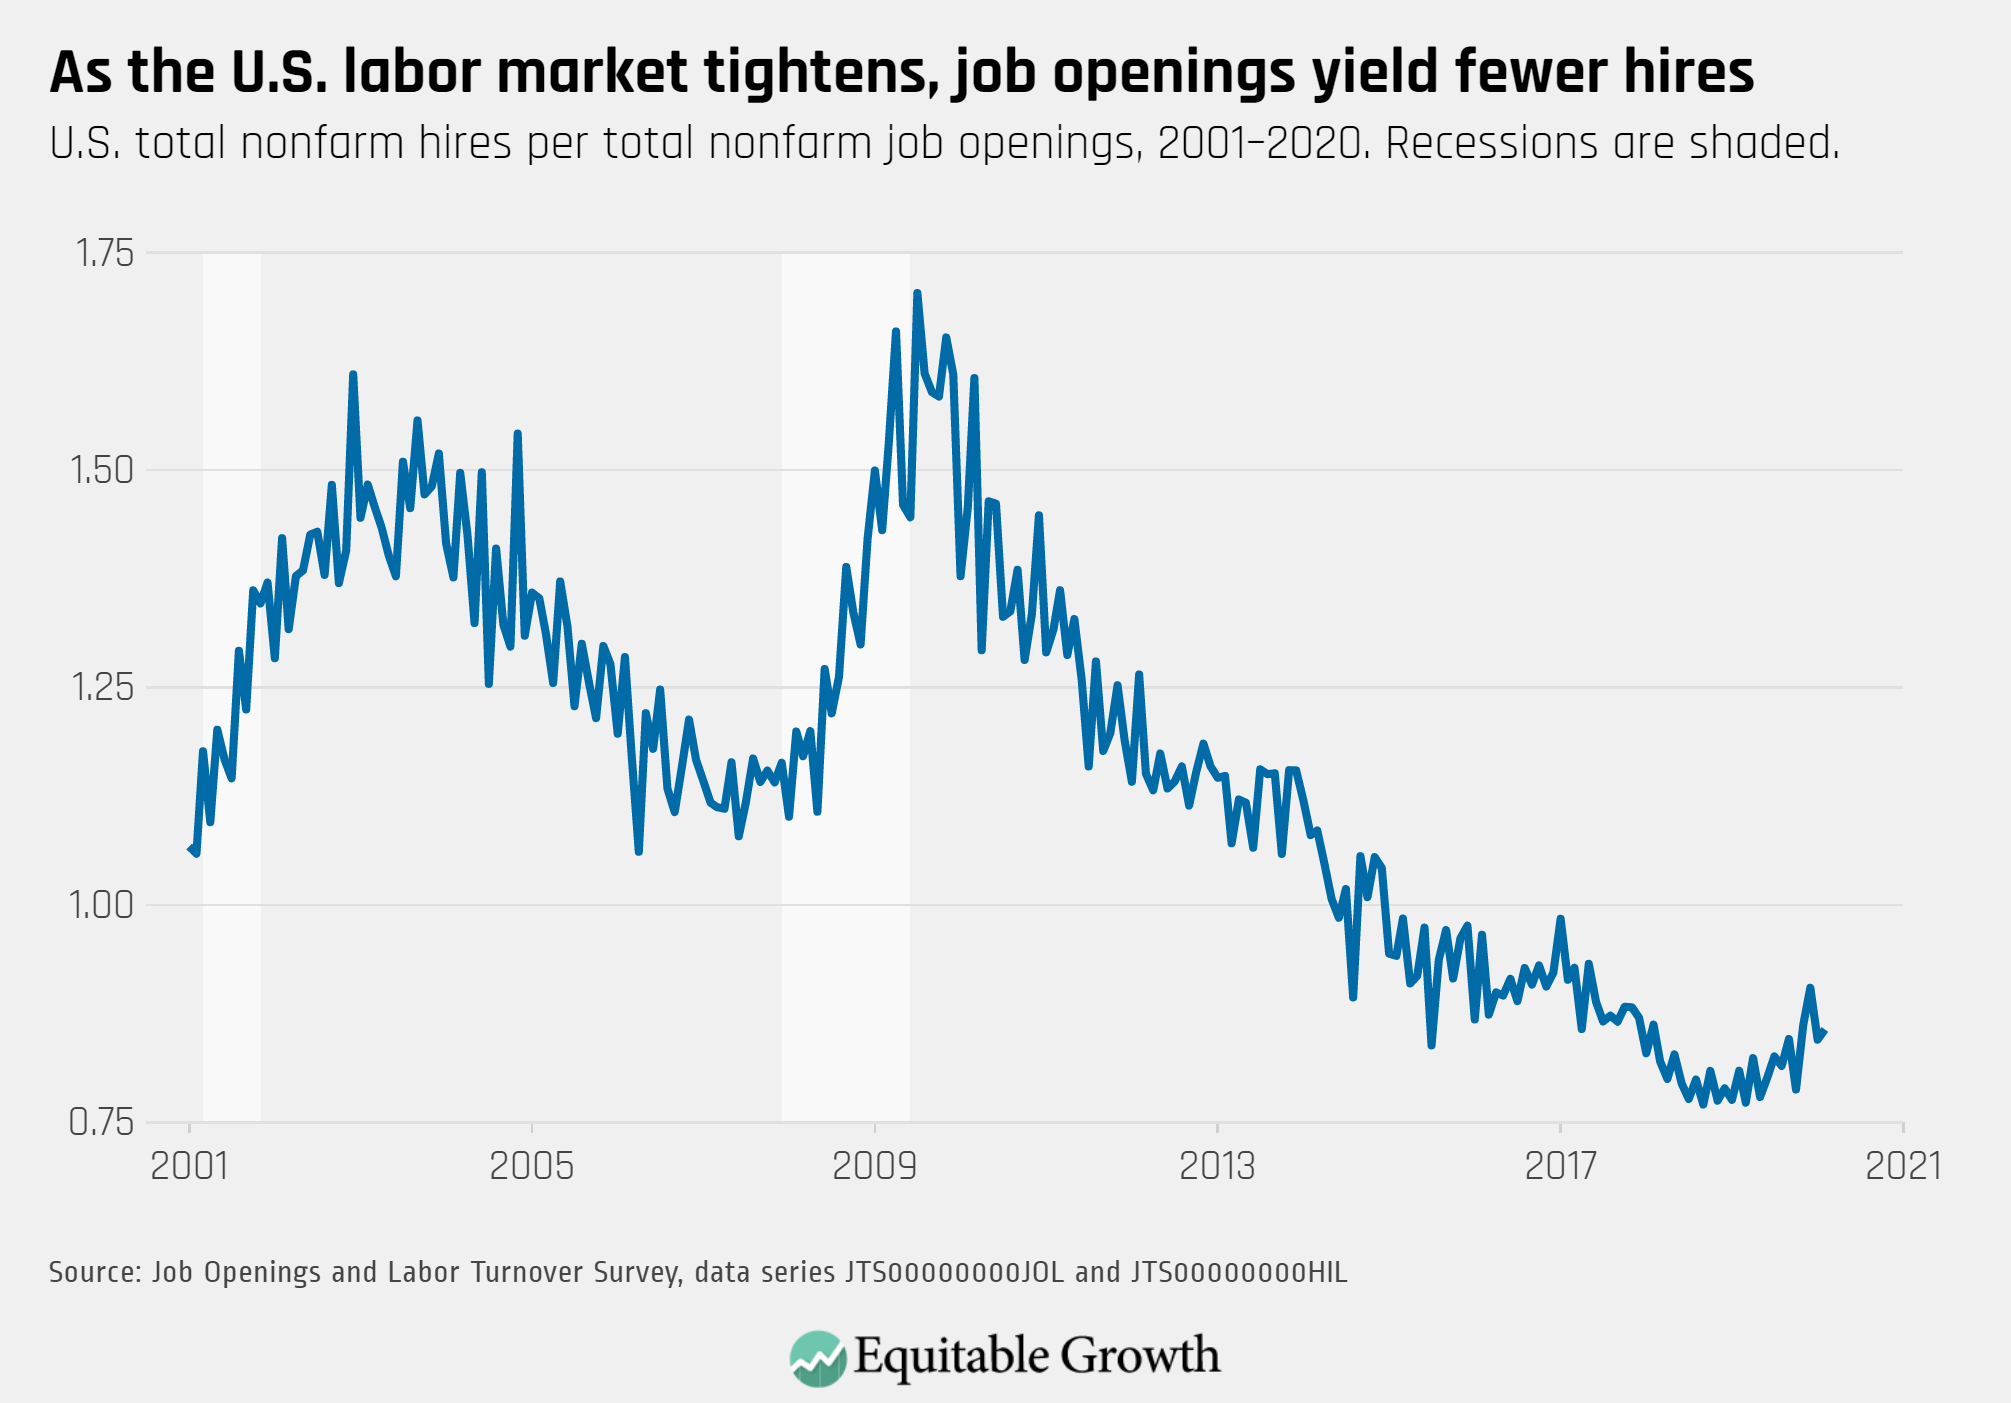
2.
The vacancy yield reflected a tight labor market with more job openings than hires taking place for the month of February.
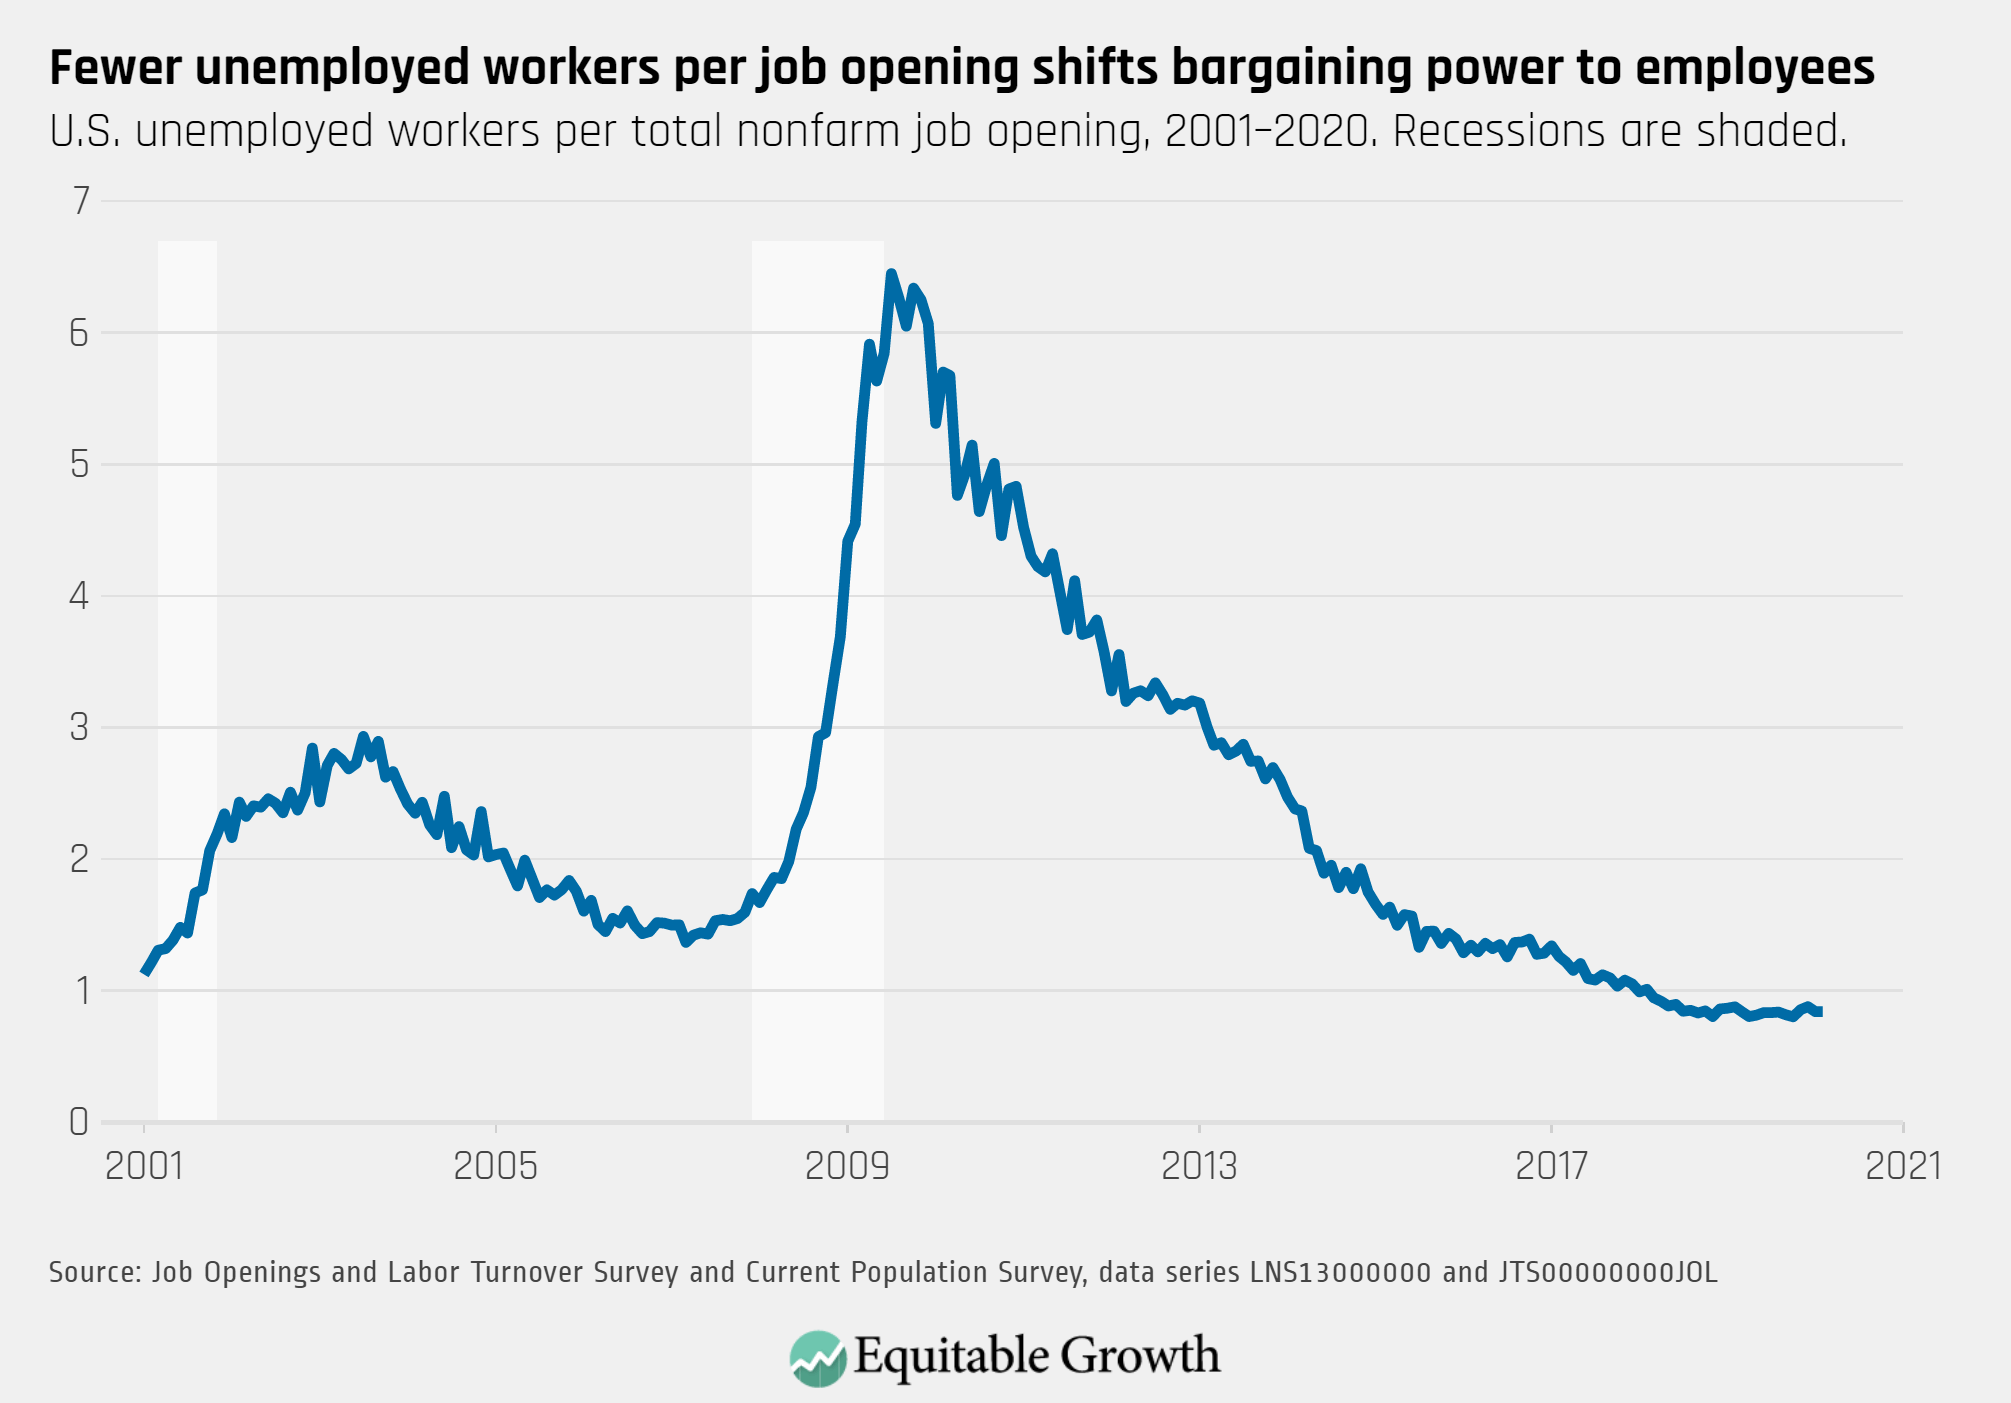
3.
February was the last month of low unemployment at a rate of 3.5%. Before March’s increase to 4.4%, there was fewer than one unemployed worker per available job opening.
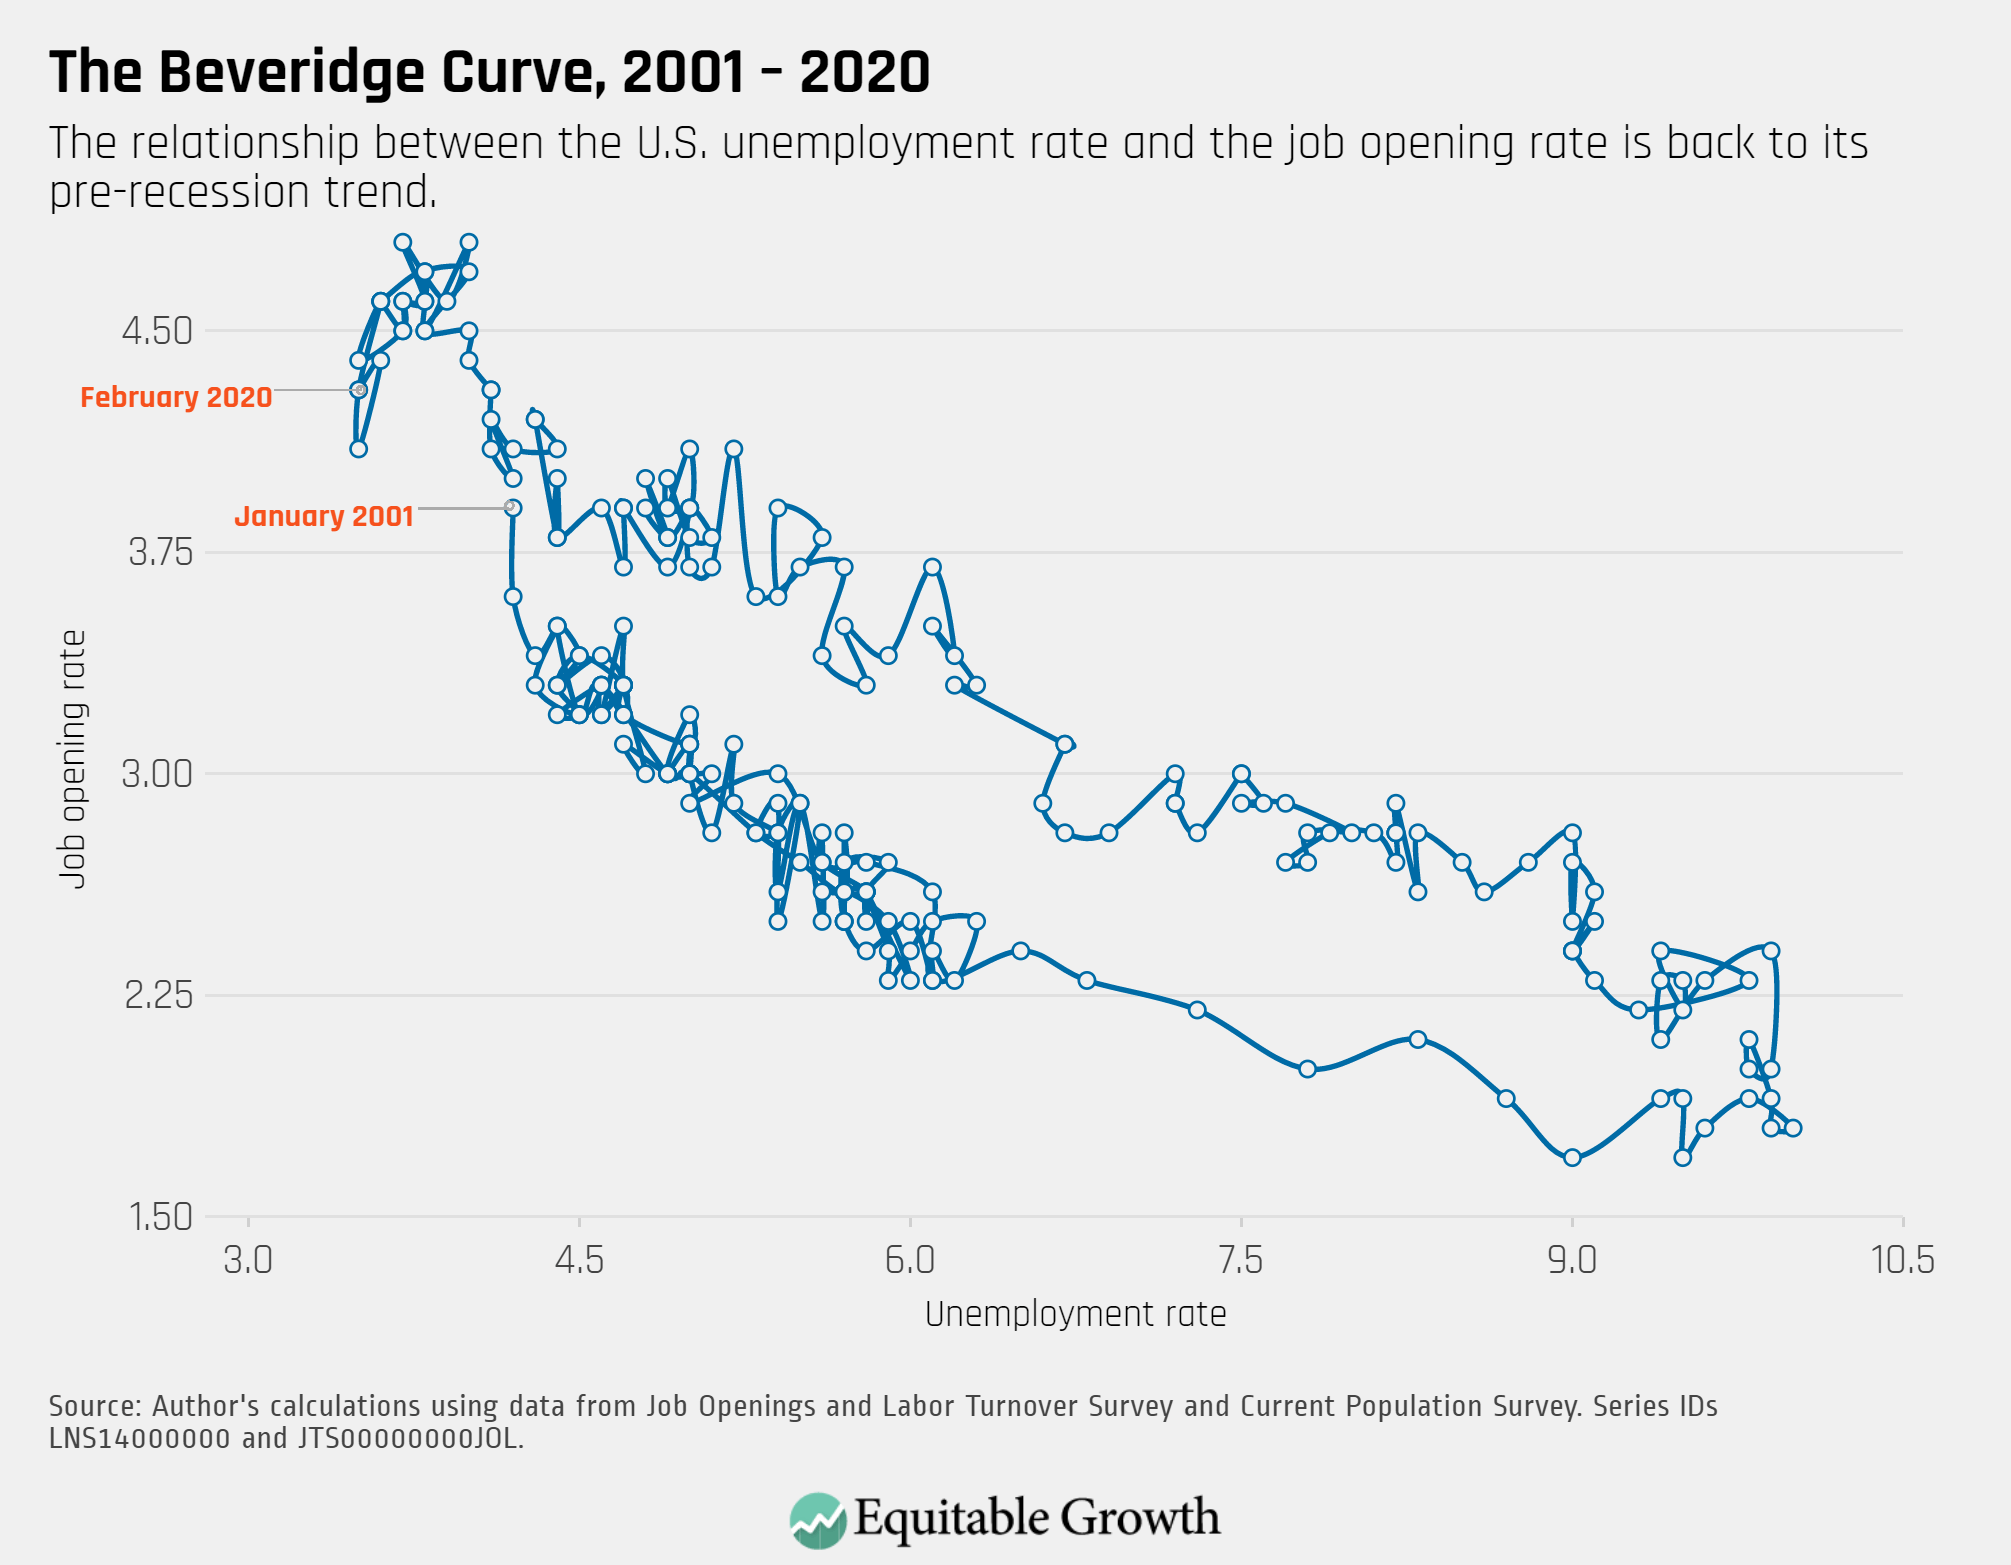
4.
The Beveridge Curve reflected an expansionary labor market before heading into the economic contraction necessary to address the coronavirus public health crisis.