JOLTS Day Graphs: December 2018 Report Edition

Every month the U.S. Bureau of Labor Statistics releases data on hiring, firing, and other labor market flows from the Job Openings and Labor Turnover Survey, better known as JOLTS. Today, the BLS released the latest data for December 2018. This report doesn’t get as much attention as the monthly Employment Situation Report, but it contains useful information about the state of the U.S. labor market. Below are a few key graphs using data from the report.

1.

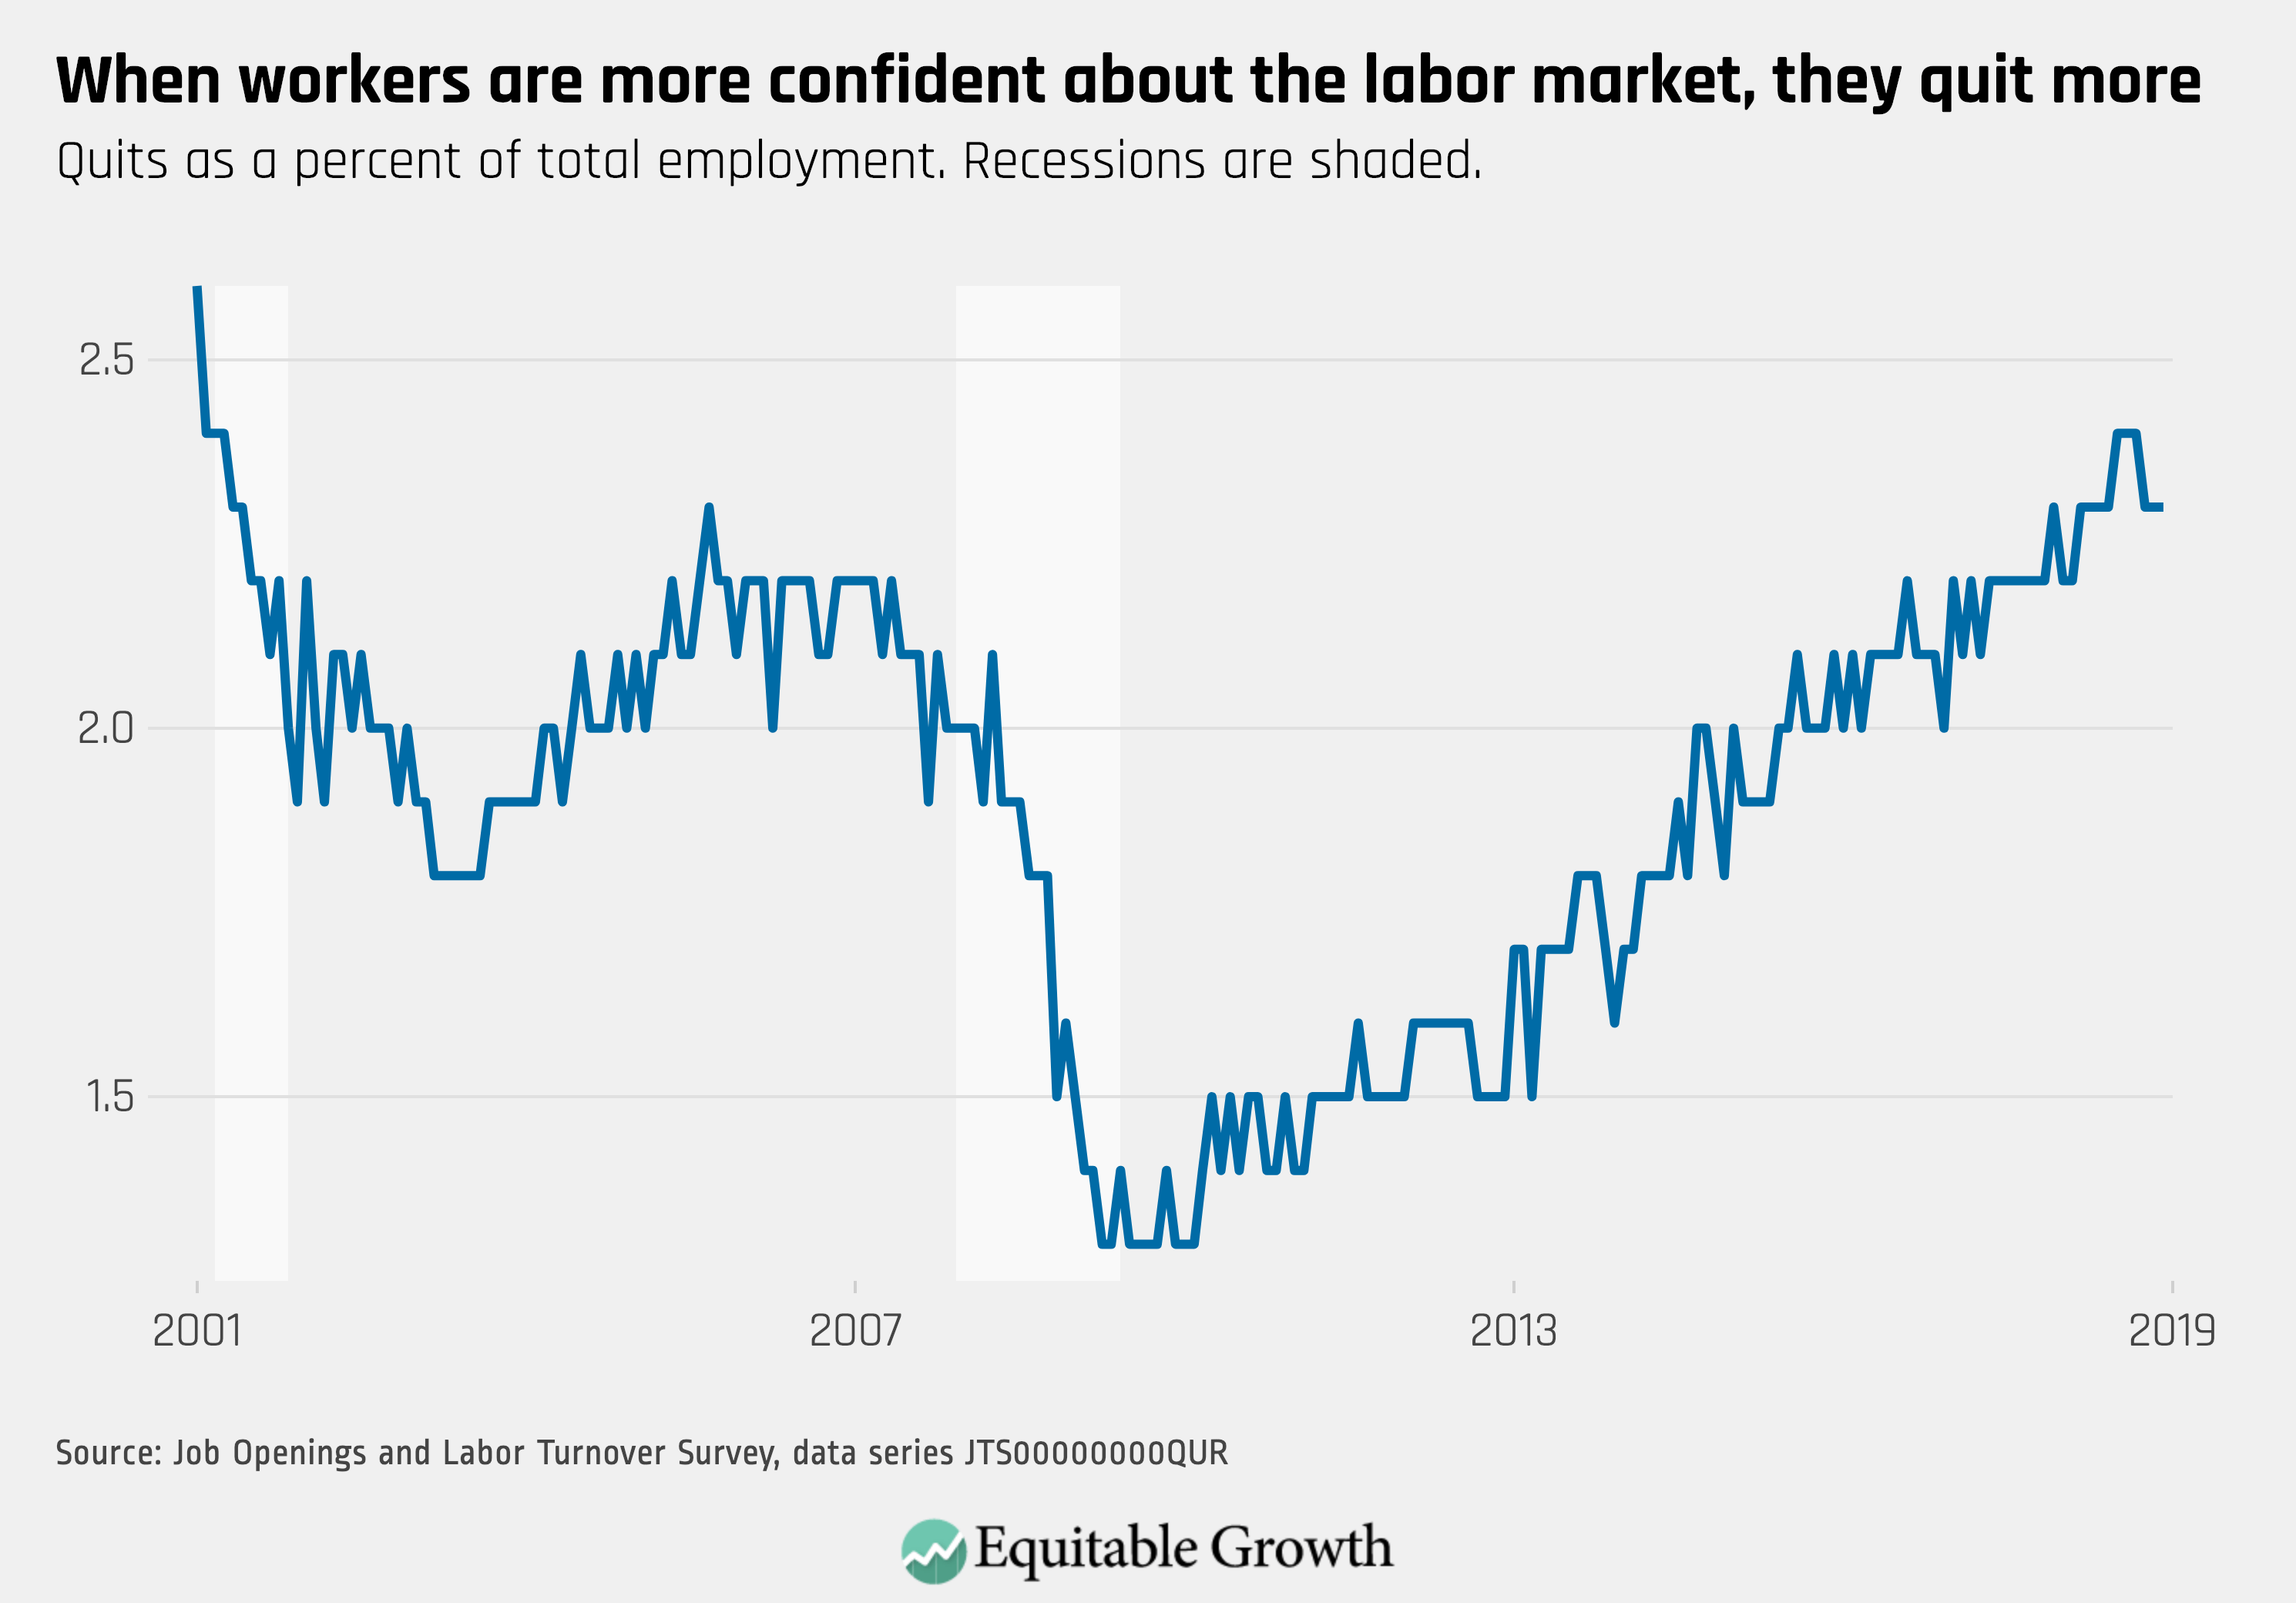
The quits rate edged down slightly in December, but it remains at high levels as workers face a labor market with historically high job openings.

2.

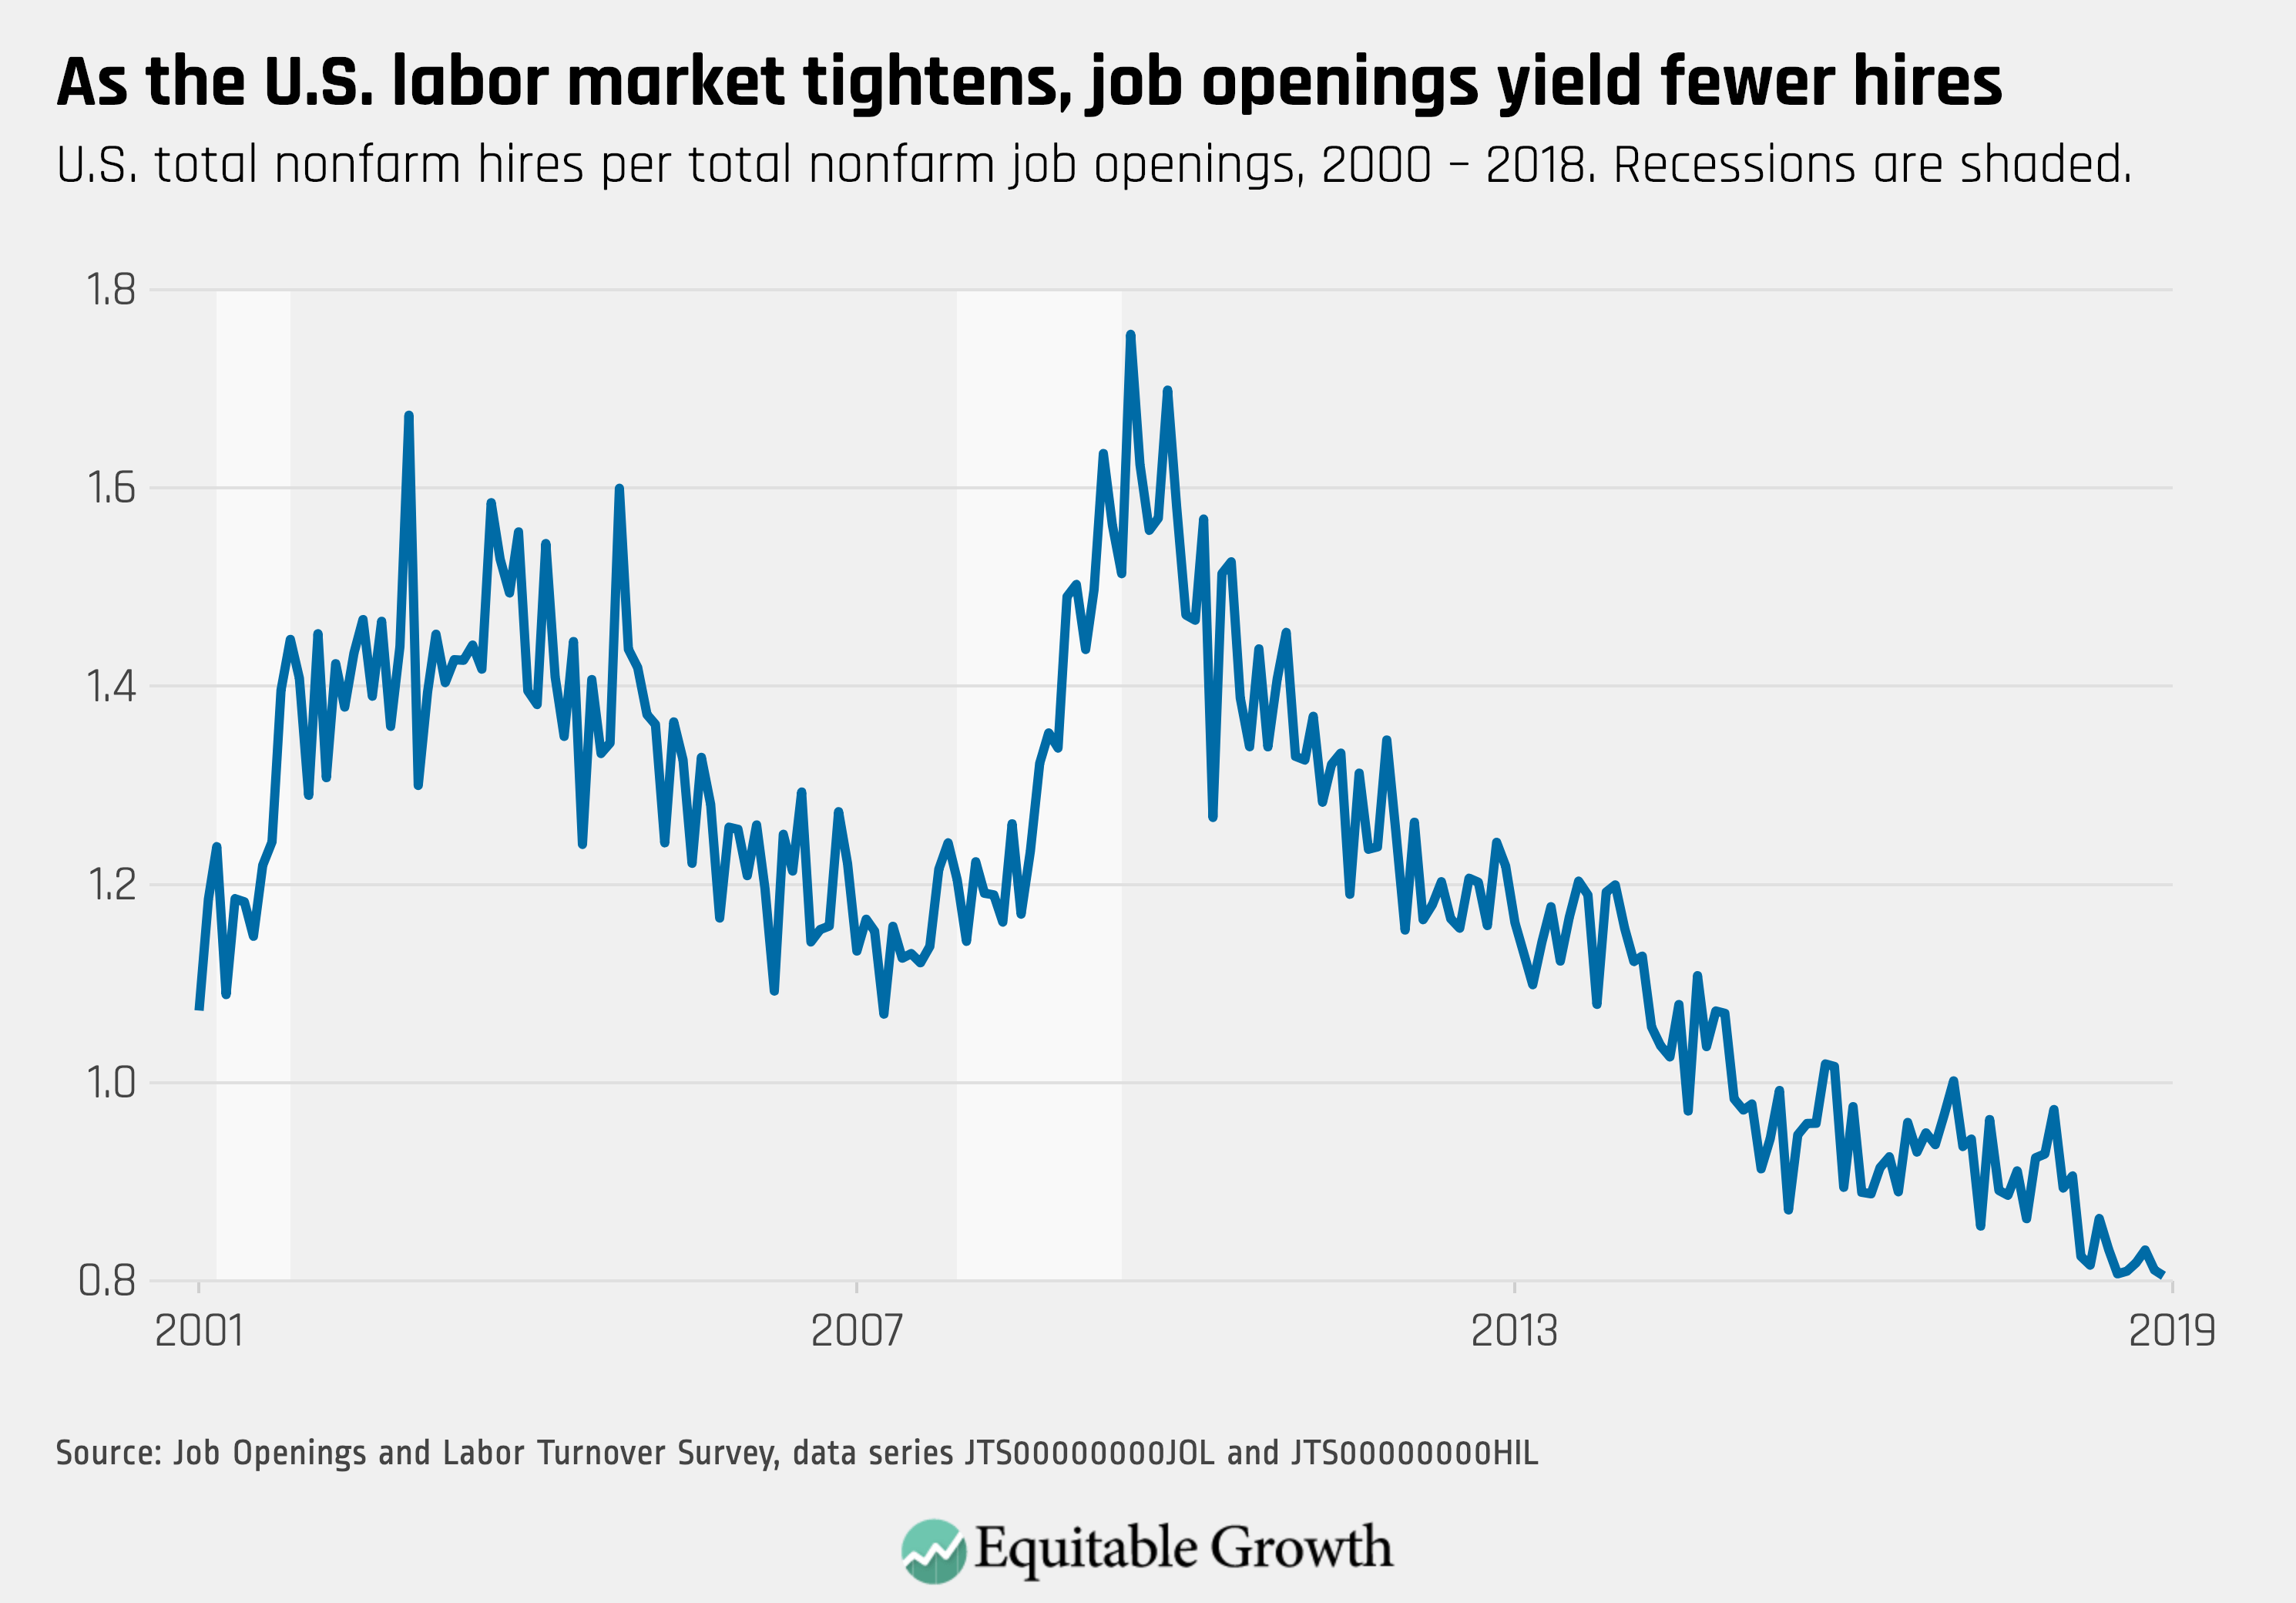
As the labor market continues to tighten, there are fewer hires per available job openings.

3.

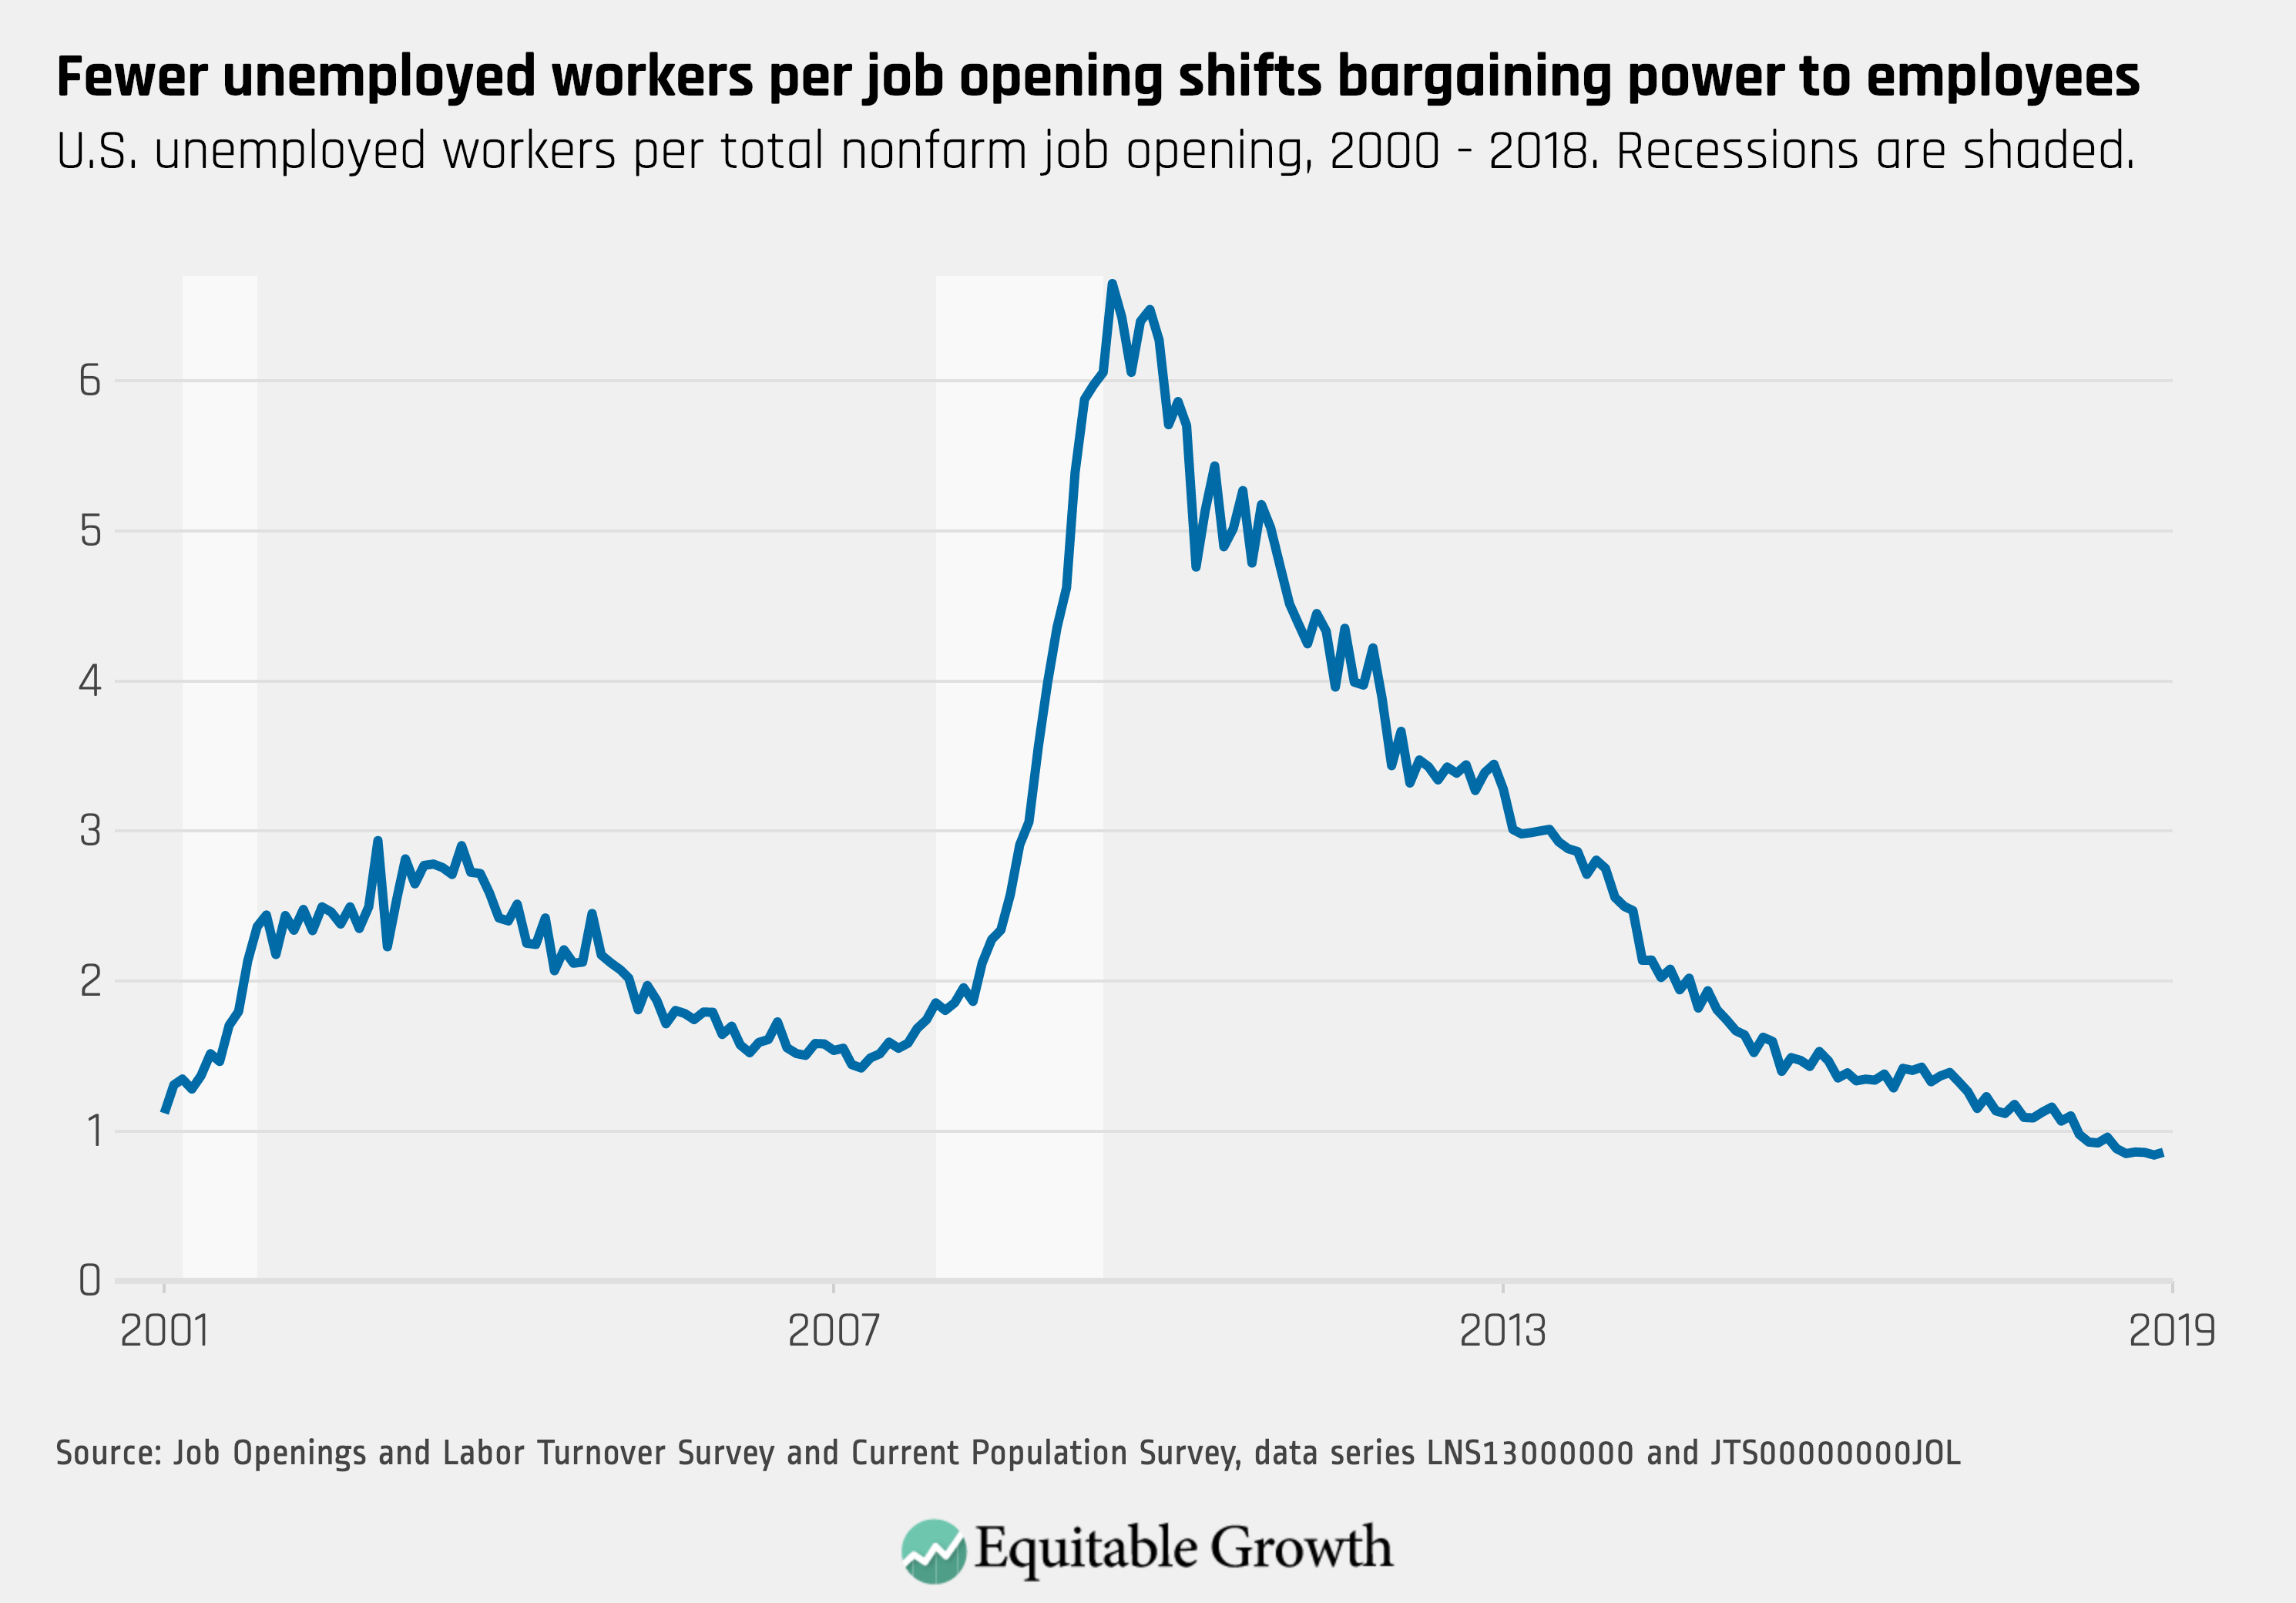
The unemployment-per-job openings ratio was unchanged in December, with less than one unemployed worker per job opening.
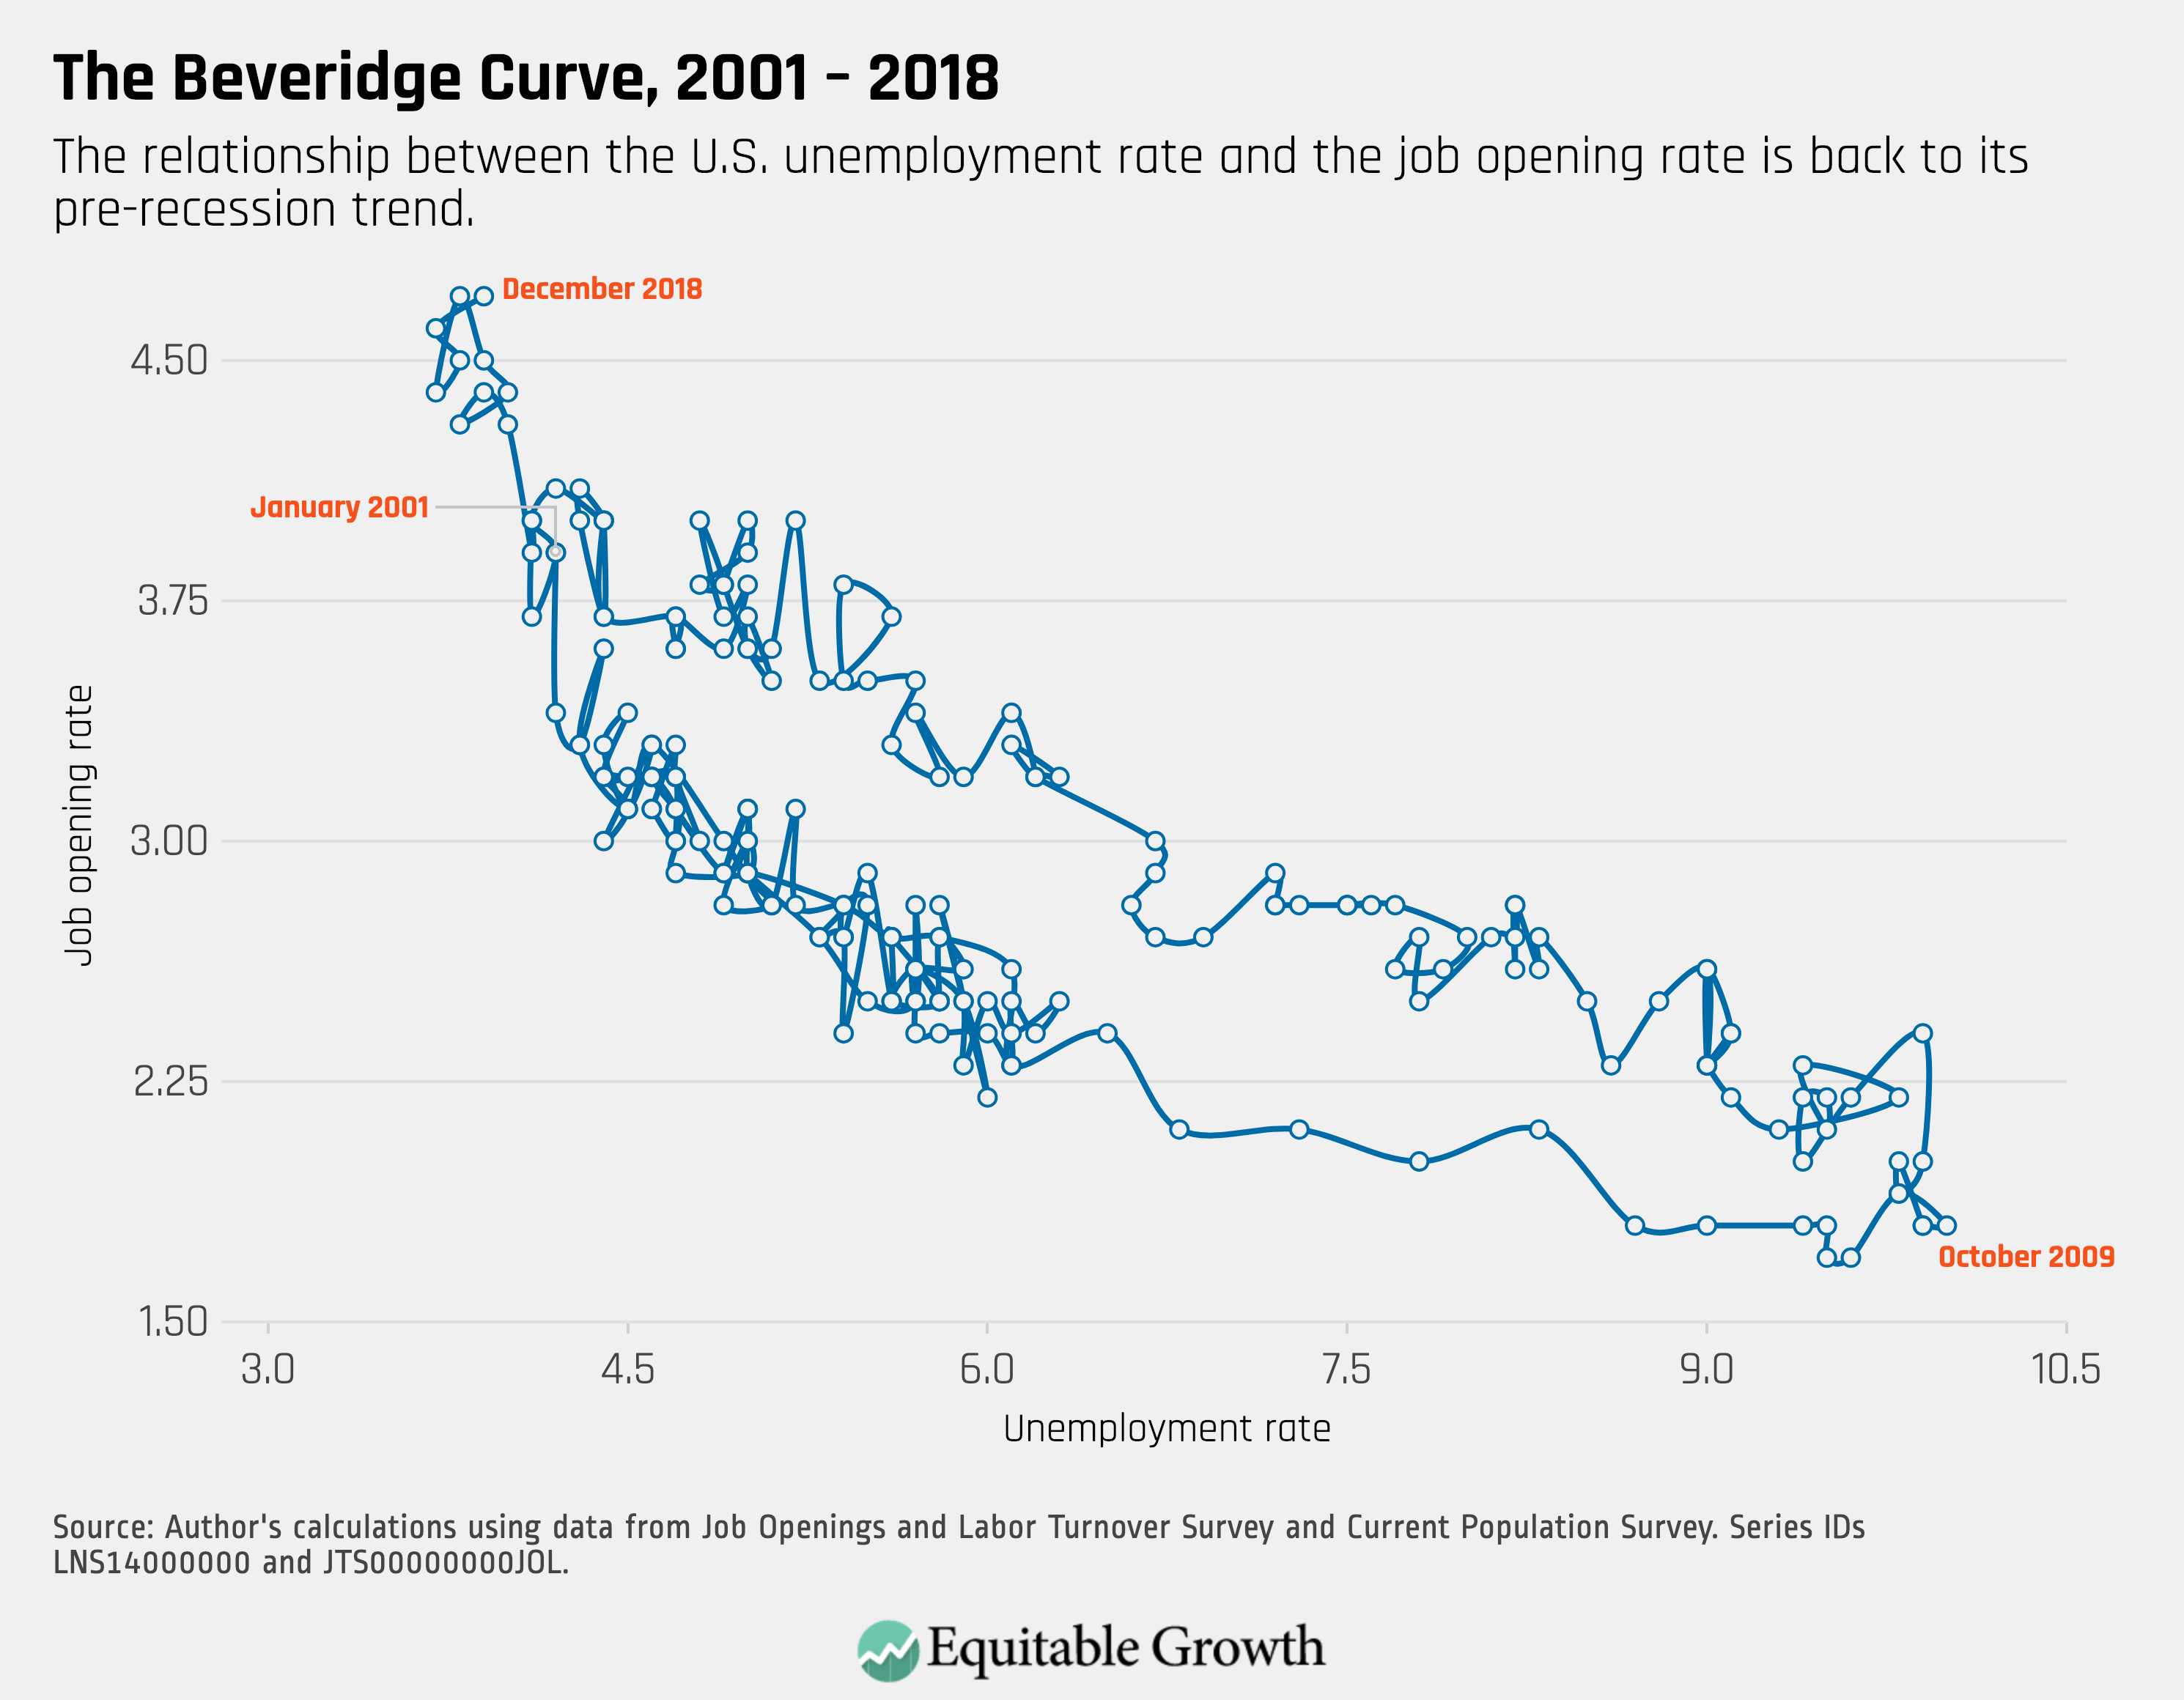
4.

The relationship between the jobs opening rate and the unemployment rate, also known as the Beveridge Curve, continues to demonstrate robust labor market conditions.

February 12, 2019

Topics

Bargaining Power

Connect with us!

Explore the Equitable Growth network of experts around the country and get answers to today's most pressing questions!

Get in Touch