Here’s why you should interpret tomorrow’s GDP growth estimate skeptically

Tomorrow morning, the Bureau of Economic Analysis will announce its first estimate for third quarter gross domestic product growth in 2017. A lot of time and energy will be spent interpreting this number. The third quarter rate will be compared to past growth and to GDP growth in other countries. Politicians will take credit or assign blame. It will be trumpeted as the one number that tells us what’s really happening in the economy.
Be skeptical. No single number can really tell us much of anything about our immensely complicated $19 trillion economy. But we have been conditioned to think about the health of the economy in terms of total output growth. We know these common refrains: “A rising tide lifts all boats” and “growing the pie.” Economic plans are based on GDP growth targets. So, it’s understandable that so many people treat this one number as somehow sacred.
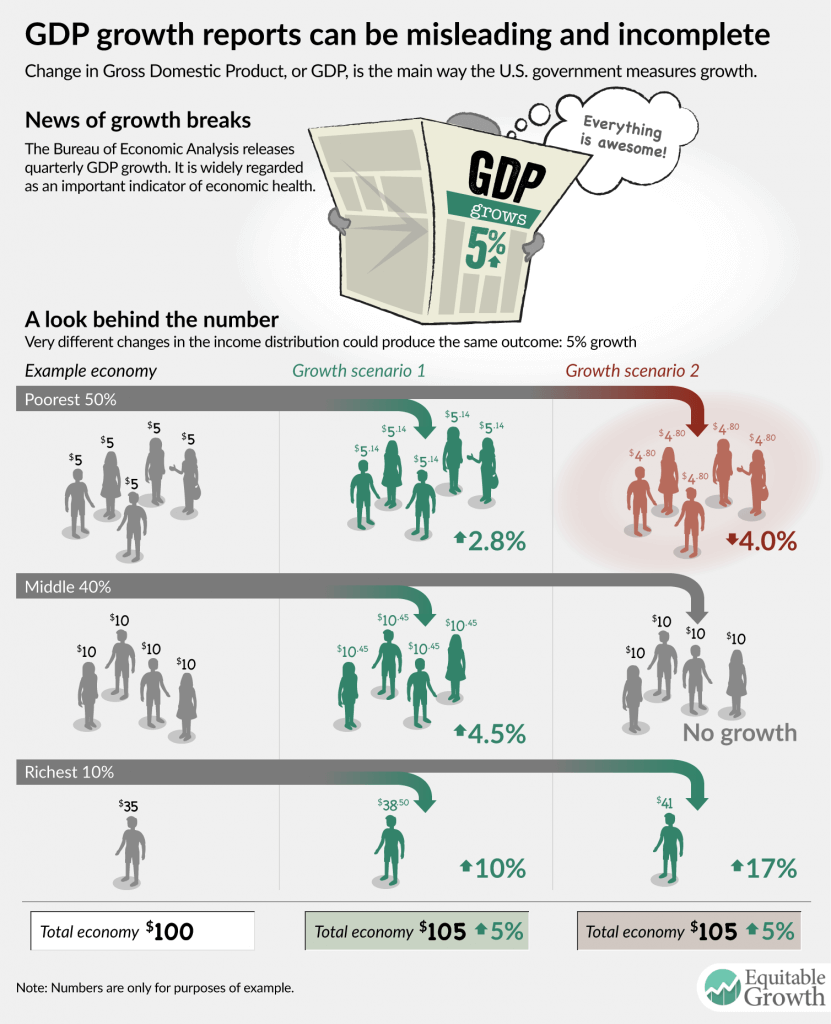
But reverence for GDP is harmful because GDP growth can be a deeply misleading way to think about the health of our economy. For example, we might think of 5 percent growth as representing an extraordinarily healthy economy. But to demonstrate why that might not be the case, we’ve put together the infographic below, which shows two possible ways that an economy might achieve 5 percent growth.

In scenario 1, growth is inequitable, but at least everyone is benefitting somewhat. Earners at the bottom see growth of 2.8 percent, while those at the top see growth of 10 percent. In this scenario, GDP is misleading, because 50 percent of the population saw much lower growth than the headline number would suggest.
In the second scenario, however, the topline number is truly and deeply out of sync with the experience of the average American. Again, growth for the economy is 5 percent, but now 90 percent of the population does not share in that growth at all. The bottom 50 percent of earners actually see their incomes reduced by 4 percent, while the next four citizens on the income ladder see complete stagnation. The only person who benefits is the richest member of society, who sees 17 percent growth. Seeing the headline GDP growth number, nine-tenths of this society might reasonably wonder on what planet government economists were living.
In fact, the second scenario is not imaginary. Consider the “double dip” recession of the early 1980s. In late 1980, GDP growth made it seem like perhaps the then-6-month-long recession was over. In reality, top incomes had surged, producing the illusion of growth, while incomes for those outside the top 10 percent had stagnated or fallen.1
Measuring the health of our economy is important. The problem with GDP growth isn’t that we shouldn’t be doing it at all but rather that we should be doing much more. Instead of publishing a single number, the Bureau of Economic Analysis could publish a range of numbers reflecting the varying fortunes of people with different incomes, living in different geographic regions, and from different ethnic and racial origins. Doing so might require Congress to expand BEA’s mandate. But the one-number-fits-all mentality of GDP growth is past due for rethinking.
End Notes
1. According to the Distributional National Accounts dataset. Thomas Piketty, Emmanuel Saez, and Gabriel Zucman, “Distributional National Accounts: Methods and Estimates for the United States.” Working Paper 22945 (National Bureau of Economic Research, 2016).
