Are estimates of the long-term U.S. unemployment rate too high?
Economists generally agree that the long-term unemployment rate is the best way to gauge when the labor market hits its equilibrium—a condition where unemployment is low, but not so low that it sparks inflationary pressures. In the United States, many economists think that equilibrium is reached when the unemployment rate hits 5 percent. But what if that rate is too high? That is a question many economists and policymakers are pondering after the U.S. Bureau of Labor Statistics released its monthly employment figures late last week, which showed that the unemployment rate in the United States declined to 5.3 percent in June.
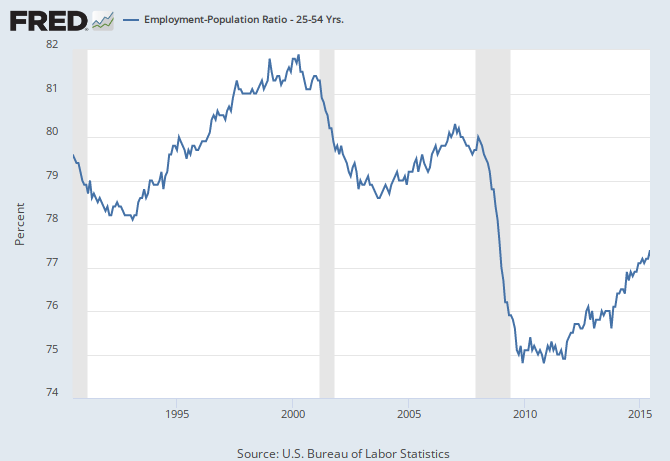
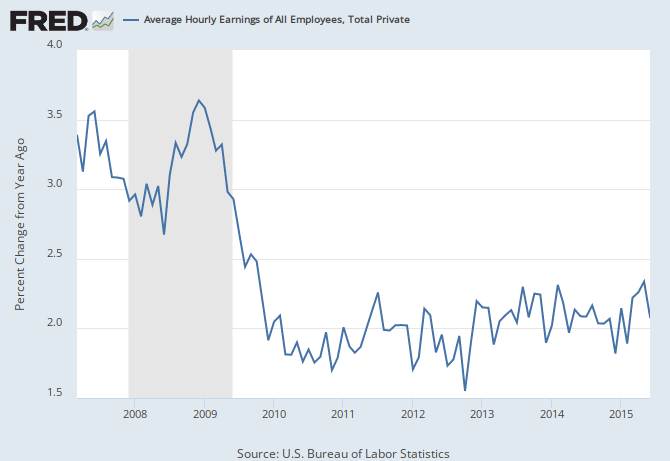
The U.S. unemployment rate is nearing that 5-percent mark, yet the labor market appears to still have quite a lot of slack demand for labor, which in turn tends to hold down inflationary pressures. The share of prime-age workers between the ages of 25 to 54 who have a job is still below its pre-recession level of 79.7 percent. The share of workers on the fringes of the labor market who would like to work is still above pre-recession levels of 3.8 percent. And wage growth, which would be strong if the labor market was tight, is still stuck at around 2 percent.
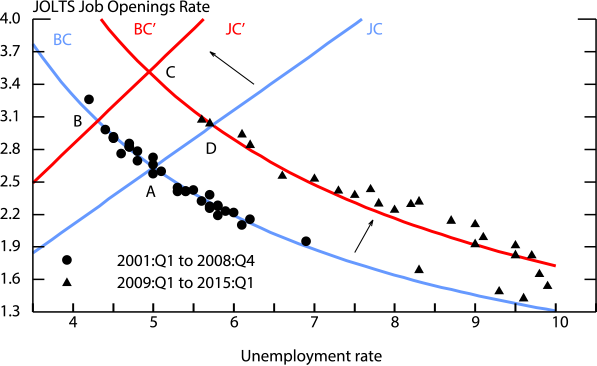
So does a long-run unemployment rate of 5 percent still make sense as a marker for the Federal Reserve Board to raise interest rates to get a jump on inflationary pressures? In a post for FEDS Notes, Federal Reserve economists Andrew Figura and David Ratner look at the relationship between the unemployment rate and the rate at which companies are posting job openings as a way to determine the long-term unemployment rate. They write that the oft-cited Beveridge Curve, which shows the relationship between the unemployment rate and the jobs-vacancy rate, has been presented as evidence that there has been an increase in the long-run unemployment rate. Yet they argue that these analyses miss other factors that affect the long-run employment rate—namely the increasing rate at which firms post job openings.
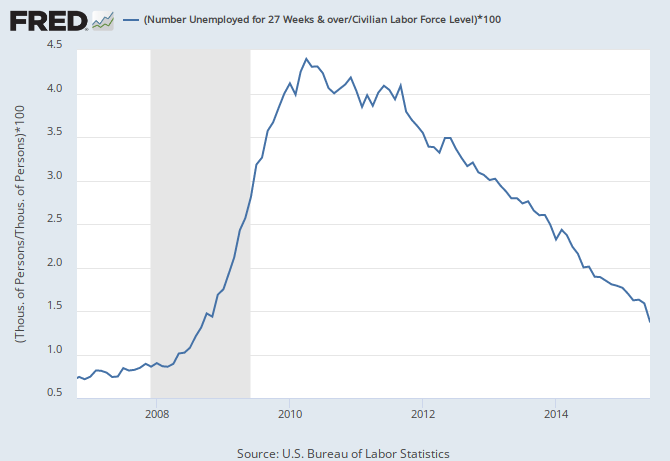
If the Beveridge Curve represents the matching of unemployed workers to job openings, then the willingness of firms to post job openings at a given unemployment rate is represented by the job-creation curve. The intersection of the downward-sloping Beveridge Curve and the upward-sloping job-creation curve gives us the long-run unemployment rate. The shift up and to the right of the Beveridge Curve is well known and appears likely to be a short-term phenomenon as it has been driven by the long-term unemployed and is on the decline. But what about the job-creation rate?
Figura and Ratner argue that the job-creation curve has shifted as well, up and to the left in this case. (The shifts of the different curves can be seen in Figure 7 of their note.) But unlike the Beveridge Curve, this shift seems to be due to a structural change in the economy. More specifically, this change is a result of the decline in worker bargaining power as evidenced by the decline in the share of income going to labor. The decline in the share of income going to labor, according to the authors, reflects the increasing power of employers over employees in the labor market. A decline in labor bargaining power means that employers receive more of a gain from each job and therefore they will post more job openings at any given level of unemployment.
What does this all mean for the long-run employment rate? If the shift in the Beveridge Curve is temporary and the increase in the willingness of firms to create job openings is more lasting, then the long-run unemployment rate is lower than previously believed. Such a change would have many implications, but an important one is that the labor market can get a whole lot tighter without fears of accelerating inflation.