New worldwide report on inequality shows how the United States compares

Academics from the Paris School of Economics and the University of California, Berkeley on Thursday debuted the first annual World Inequality Report. This report, part of the WID.world project, includes work from dozens of academics across the globe who, applying a standardized procedure, assembled inequality statistics for more than 70 countries. The WID.world team can now speak with authority about current levels and trends of inequality worldwide. I’ve highlighted three major implications from the report for the United States below, using graphs from the report.
Although income inequality increased everywhere between 1980 and 2016, it increased at an especially rapid clip in the United States, eclipsing the rate of increase in other developed nations.
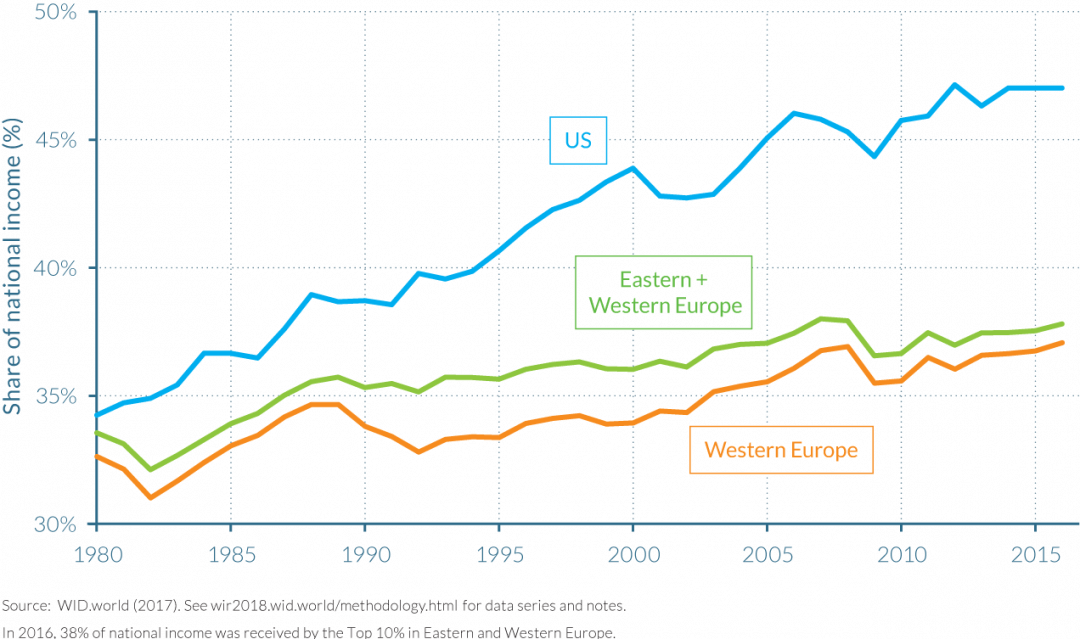
The share of national income held by the richest 10 percent of the population in the United States increased to around 47 percent in 2016 from under 35 percent in 1980. By contrast, European nations saw a much more gradual increase, with considerable differences between nations. (See Figure 1.)
Figure 1
United States leads Europe in income inequality
Share of national income for the top 10 percent in United State and Europe
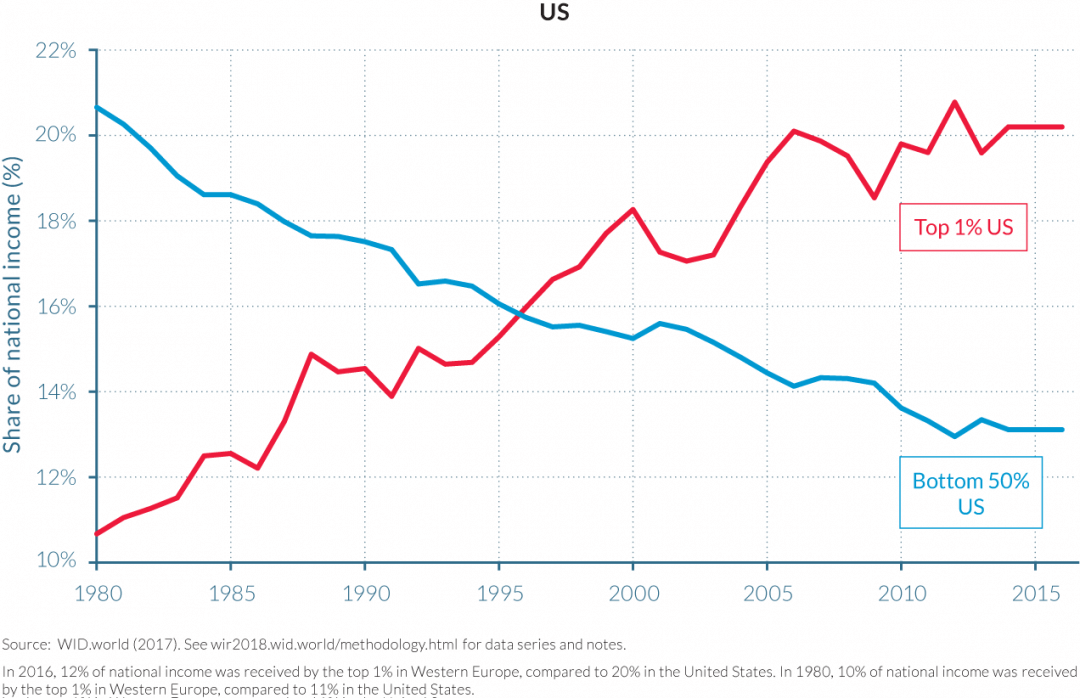
The contrast is even more pronounced when you compare income shares of the top 10 percent to the bottom 50 percent of income earners in the United States. While the top 1 percent now holds a share of total income about equal to the 20 percent held by half the population in 1980, the poorest half of Americans now hold just 13 percent of all income—essentially swapped positions. (See Figure 2.)
Figure 2
Share of income flips in the United States
Top 1 percent and bottom 50 percent shares of national income between 1980 and 2016
Income inequality is not an inevitable and unavoidable consequence of modern economics. While inequality soared in the United States, it rose much more gently, or even remained level, in many Western European nations.
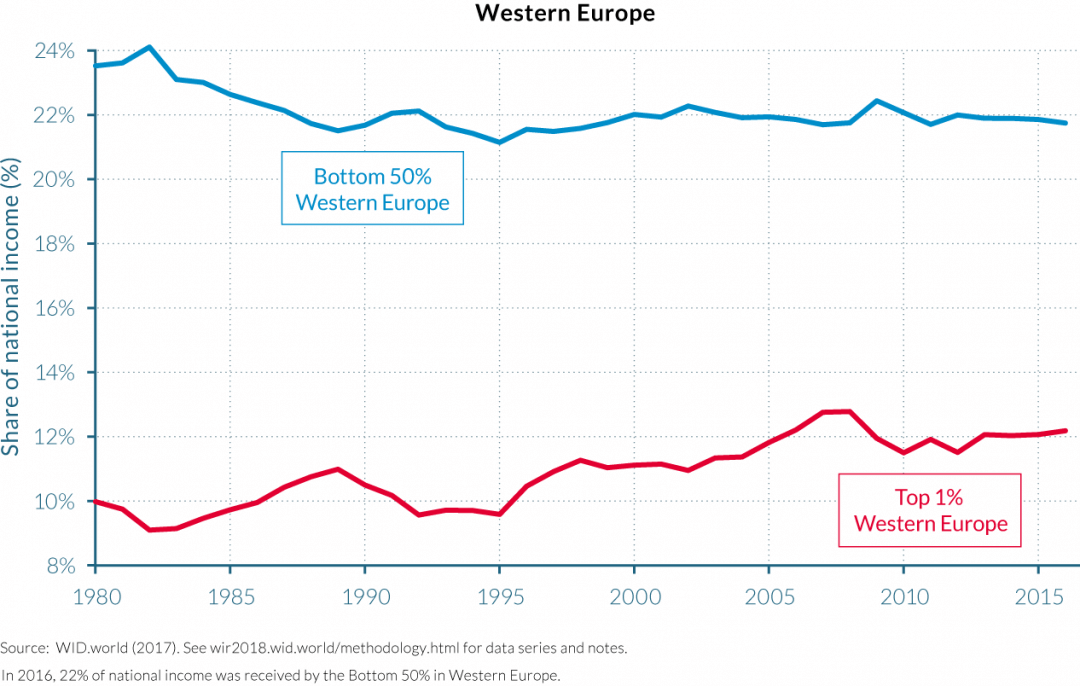
The report’s authors emphasize that rising income inequality is not inevitable. It is attributable at least in part to deliberate policy decisions that have increased the incomes of the rich. Although inequality is rising in Western Europe and the United States, the pace is dramatically different. (See Figure 3.)
Figure 3
Leading European nations experience less dramatic rise in income inequality
Top 1 percent and bottom 50 percent shares of national income in Western Europe between 1980 and 2016
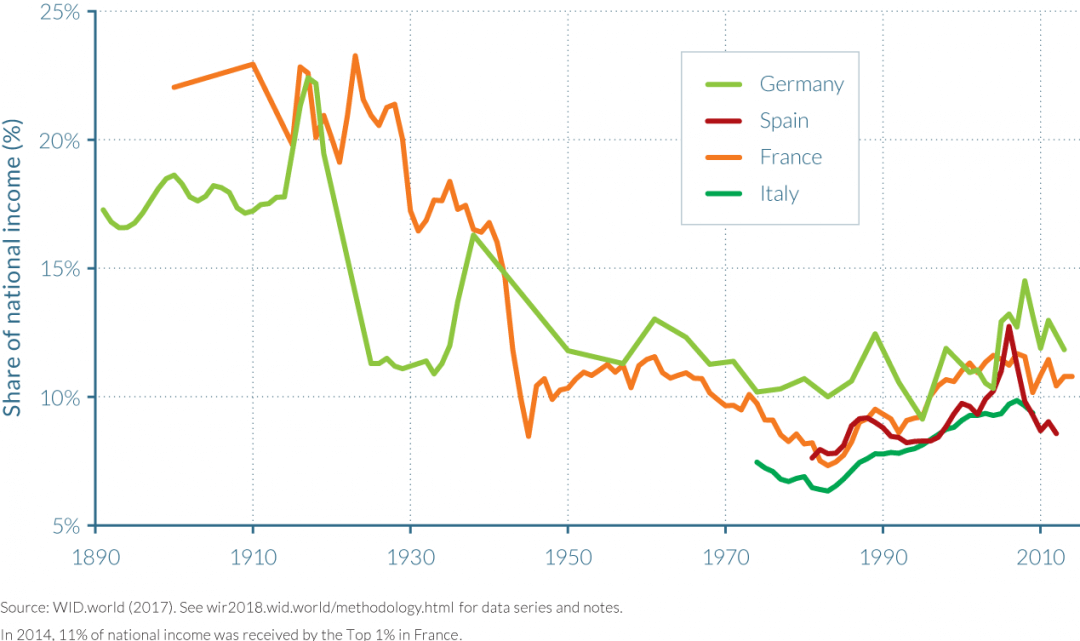
Disaggregating the data by country in Europe shows a similar pattern. Income inequality has increased since the 1980s, but rises in major European economies have been modest. (See Figure 4.)
Figure 4
Four major European economies show modest rise in income inequality
Top 1 percent income shares in France, Germany, Spain, and Italy, from 1890 to 2014
Although the United States exhibited higher income growth than the European average over this period, most Americans did not share in that growth. These Americans saw their incomes stagnate and lag behind their European peers.
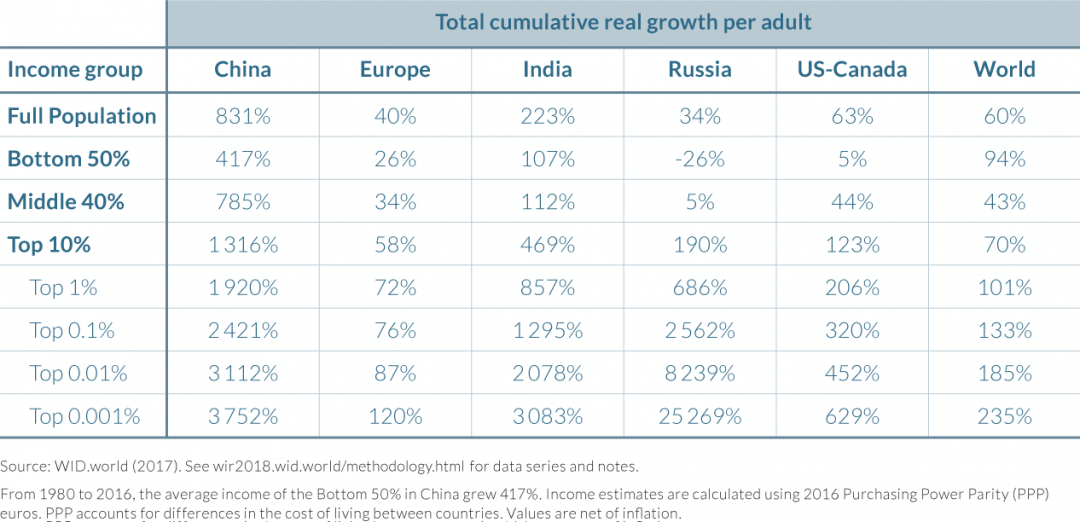
The bottom 50 percent of income earners in the United States and Canada registered income gains of just 5 percent from 1980 to 2016 despite average growth of 63 percent, after accounting for inflation. By contrast, the poorest half of the population in Europe saw income growth of 26 percent. The upper middle class (what the authors of the report call the middle 40 percent, which represents those above the 50th percentile in wealth and below the 90th percentile) in the United States did a bit better than their Western European equivalents. But the real story is at the top of the income distribution, where the top 1 percent enjoyed unmatched income growth beat only by rapidly growing developing countries. The top 1 percent in the United States experienced an astounding 206 percent total increase in income. (See Table 1.)
Table 1
United States second to China in the growth of income inequality
Growth across regions of the world by income quantile, 1980 to 2016
These findings are the result of the continuing expansion of the WID.world project, which is adding new data series and new countries as researchers take up the challenge of adding more data to the project. Future releases of the report will let economists and policymakers track how income inequality is changing in the United States and how the nation compares to other countries. This first release shows the unusual position of the United States among developed countries and makes it clear that for the past three decades, income has not been trickling down the income ladder.

