
A snapshot of the argument at the heart of the federal budget debate

Key takeaways
- The argument over the size of the federal budget centers around whether structural federal spending should be in line with what the U.S. government has historically spent in relation to GDP, regardless of circumstances, or instead reflect specific policy choices that can and do change when demands and underlying dynamics change.
- In practice, insisting that federal budget levels should match historical averages has resulted in lower taxes but higher deficits, as policymakers over the past 25 years prioritized returning revenue levels, but not spending levels, to a historical average.
- What this means for growth: A federal budget that responds to current needs—such as an older U.S. population—with proportional changes to spending and revenue results in lower deficits, delivers on policy promises, and strengthens the American economy.
Overview
Over the past few weeks, the federal budget, and especially the persistent and large budget deficit, has been thrust back into the news. With it, the argument about who is to blame has reentered the conversation. Such debates obscure a more complex disagreement over the size of the budget and if it should respond to changing circumstances or follow historical trends.
Historically, allowing the federal budget to adapt to current needs has led to relatively equal changes in spending and revenue, leading to a more balanced budget. Yet leaning on historical averages as an argument to cut taxes has created an imbalance between spending and revenue, which is often used as a misguided argument against higher spending. So let’s first look at what is not up for debate.
The structural budget gap
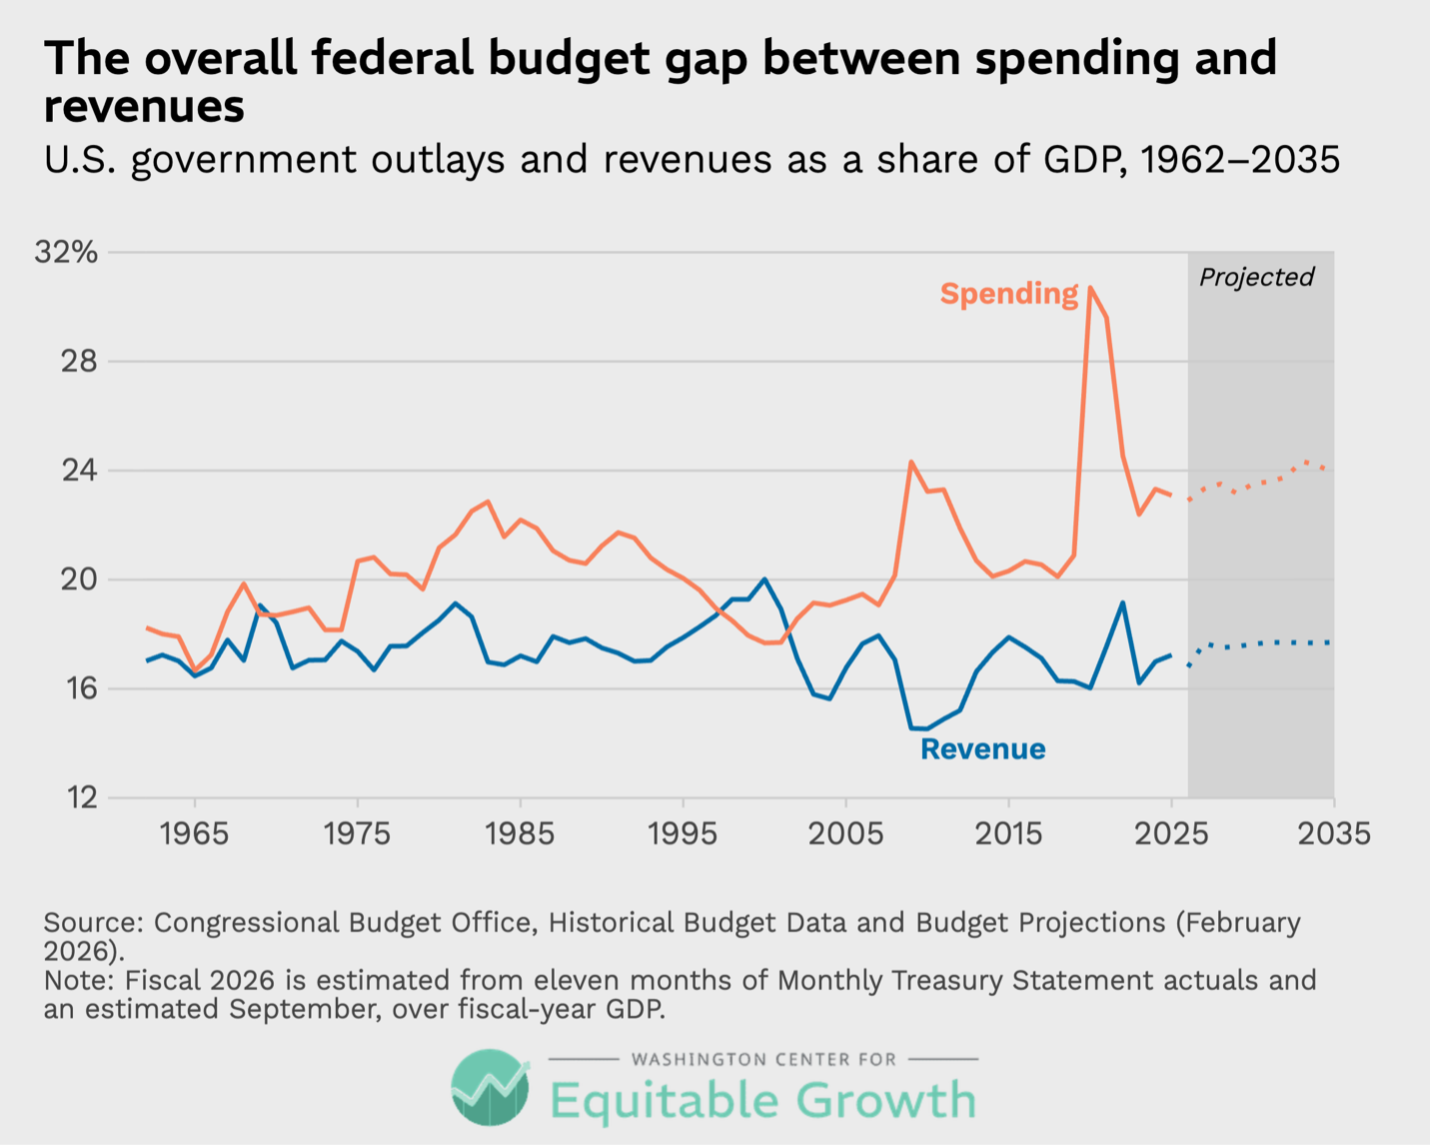
In Fiscal Year 2026 ending last month, the federal government collected just under 17 percent of Gross Domestic Product (GDP) in total revenue. At the same time, total federal spending was 23 percent of GDP. That gap of 6 percentage points of GDP is essentially all structural, meaning it is driven by persistent policies not extenuating circumstances.1 (See Figure 1.)
Figure 1
If policymakers are to reduce the structural budget gap, it is useful to understand where it came from. The debate over the federal budget gap can largely be broken down into two fundamentally opposing worldviews.
A budget anchored in history: exploring this perspective in its strongest form
The first worldview holds that there are generally appropriate levels of federal spending and federal taxation, bounded by historical averages. The U.S. tax code, therefore, should be built so that revenue is sufficient to finance that historical level of spending, but no more.
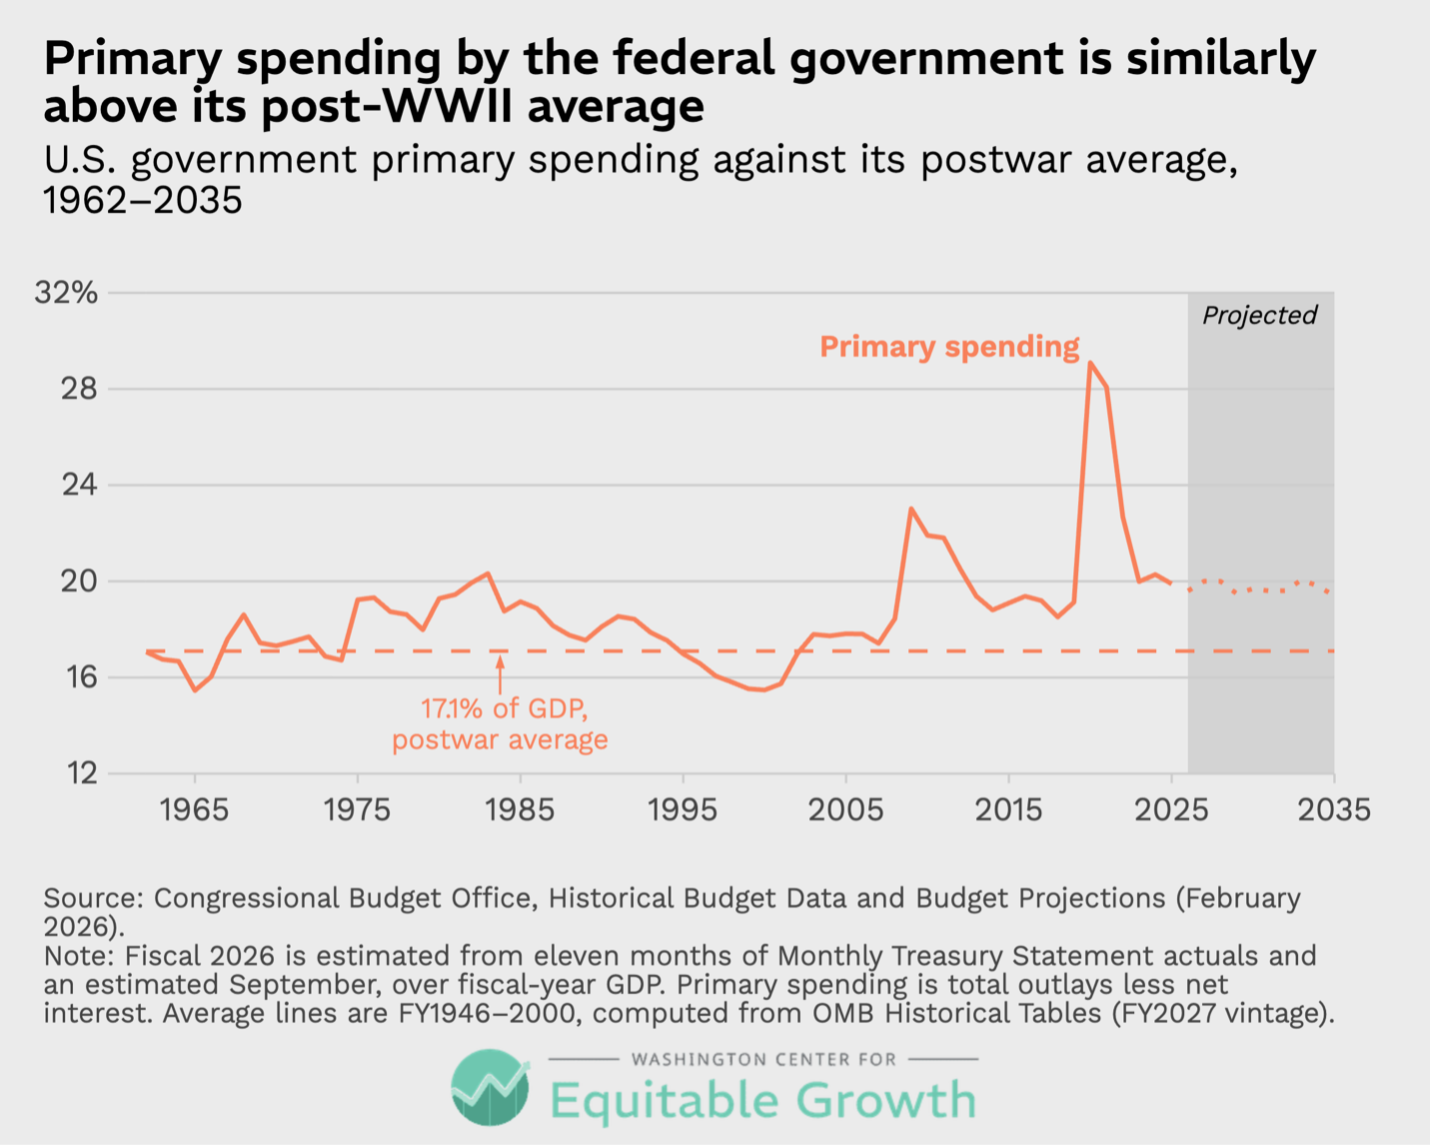
Federal spending is higher today than it’s ever been, even as revenue levels are well within their historical range. If spending on programs and operations, or primary spending, was at 17.1 percent of GDP today, as it was during the post-WWII period, then the structural budget gap would be less than 1 point of GDP, instead of 6 points. (See Figure 2.)
Figure 2
This is the strongest version of the first perspective’s argument. At the same time, historical averages are not necessarily useful benchmarks against which to judge current federal spending levels. The implication that changes in the U.S. economy and society, as well as changing national needs or wants, should not affect spending levels negates our ability to adapt to changing circumstances.
A budget that moves: exploring this perspective in its strongest form
The second worldview takes a very different conceptual approach. In this view, federal spending and revenue are not tied to historical averages or norms but are the products of policy choices that have long-term consequences. That being said, an increase in costs does not need to result in a fiscal gap, so long as the revenue base is designed to handle it.
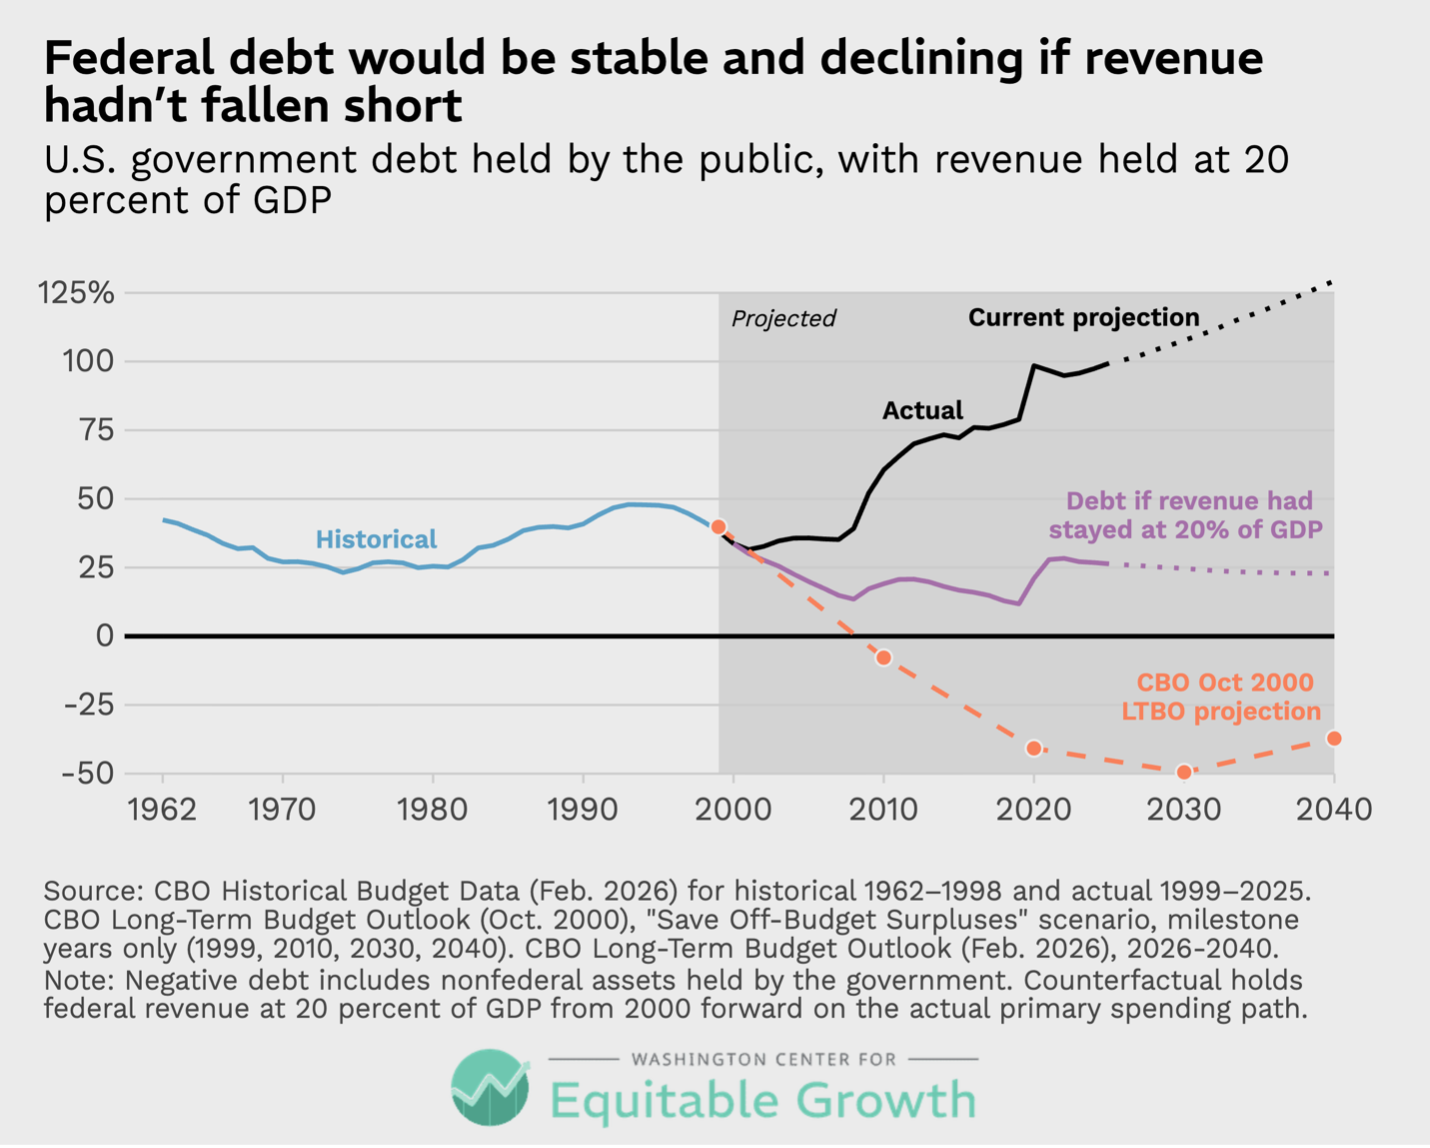
As of 2000—and in fact well before it—the federal government’s fiscal outlook already foresaw and incorporated the impact that retirement of the baby boom generation would have on the federal budget. However, when these projections were made, revenue levels were also higher—at 20 percent of GDP—and they were expected to stay that way.
And yet, the budget gap is much larger today than it was projected to be in 2000 because revenue did not stay at 20 percent of GDP, as expected. Instead, tax cuts enacted in 2001, 2003, 2017, and 2025, and tax extensions in 2012 contributed to revenue falling short of expectations every year for 25 years. Today, instead of generating 20 percent of GDP in revenue or more, the tax code generates less than 17 percent. (See Figure 3.)
Figure 3
While both worldviews are valid, one is clearly stronger than the other when it comes to fiscal responsibility
Preferring lower taxes and lower government spending is an entirely valid viewpoint. But those who hold the first worldview and apply it to the federal budget must grapple with the fact that this view only makes sense if you pursue policies that both reduce spending back to the “acceptable” level and then reduce taxes to match.
Far too often, those who claim to espouse this worldview are in fact simply using it as a cover for a different worldview entirely: namely that taxes must always remain low, regardless of changes in fiscal circumstances. This may be defensible as a separate premise, but not as a worldview for fiscal responsibility.
The budget debate, translated
If policymakers look at this fiscal history and argue, “We have a spending problem,” what they are really saying, is “I prefer low taxes, even if it means higher deficits.” But if they look at this history and argue, “Tax cuts are the problem,” what they are really saying is, “We can and should provide health care and retirement security to senior citizens, but it will require higher taxes if we want to avoid excessive borrowing.”
Once again, both perspectives are valid, but only the second one takes fiscal responsibility seriously.
Did you find this content informative and engaging?
Get updates and stay in tune with U.S. economic inequality and growth!
End Notes
1. Author’s calculation from the Monthly Treasury Statement for August 2026, Tables 1 and 9, U.S. Treasury Fiscal Data. Eleven months are actual; September 2026 is estimated from the relationship between September and an average month in prior years, corrected for benefit payment timing shifts. Fiscal year GDP is the average of the four quarterly figures from the U,S. Bureau of Economic Analysis, with the third quarter of 2026 estimated.



Stay updated on our latest research