JOLTS Day Graphs: January 2018 Report Edition
Every month the U.S. Bureau of Labor Statistics releases data on hiring, firing, and other labor market flows from the Job Openings and Labor Turnover Survey, better known as JOLTS. Today, the BLS released the latest data for January 2018. This report doesn’t get as much attention as the monthly Employment Situation Report, but it contains useful information about the state of the U.S. labor market. Below are a few key graphs using data from the report.
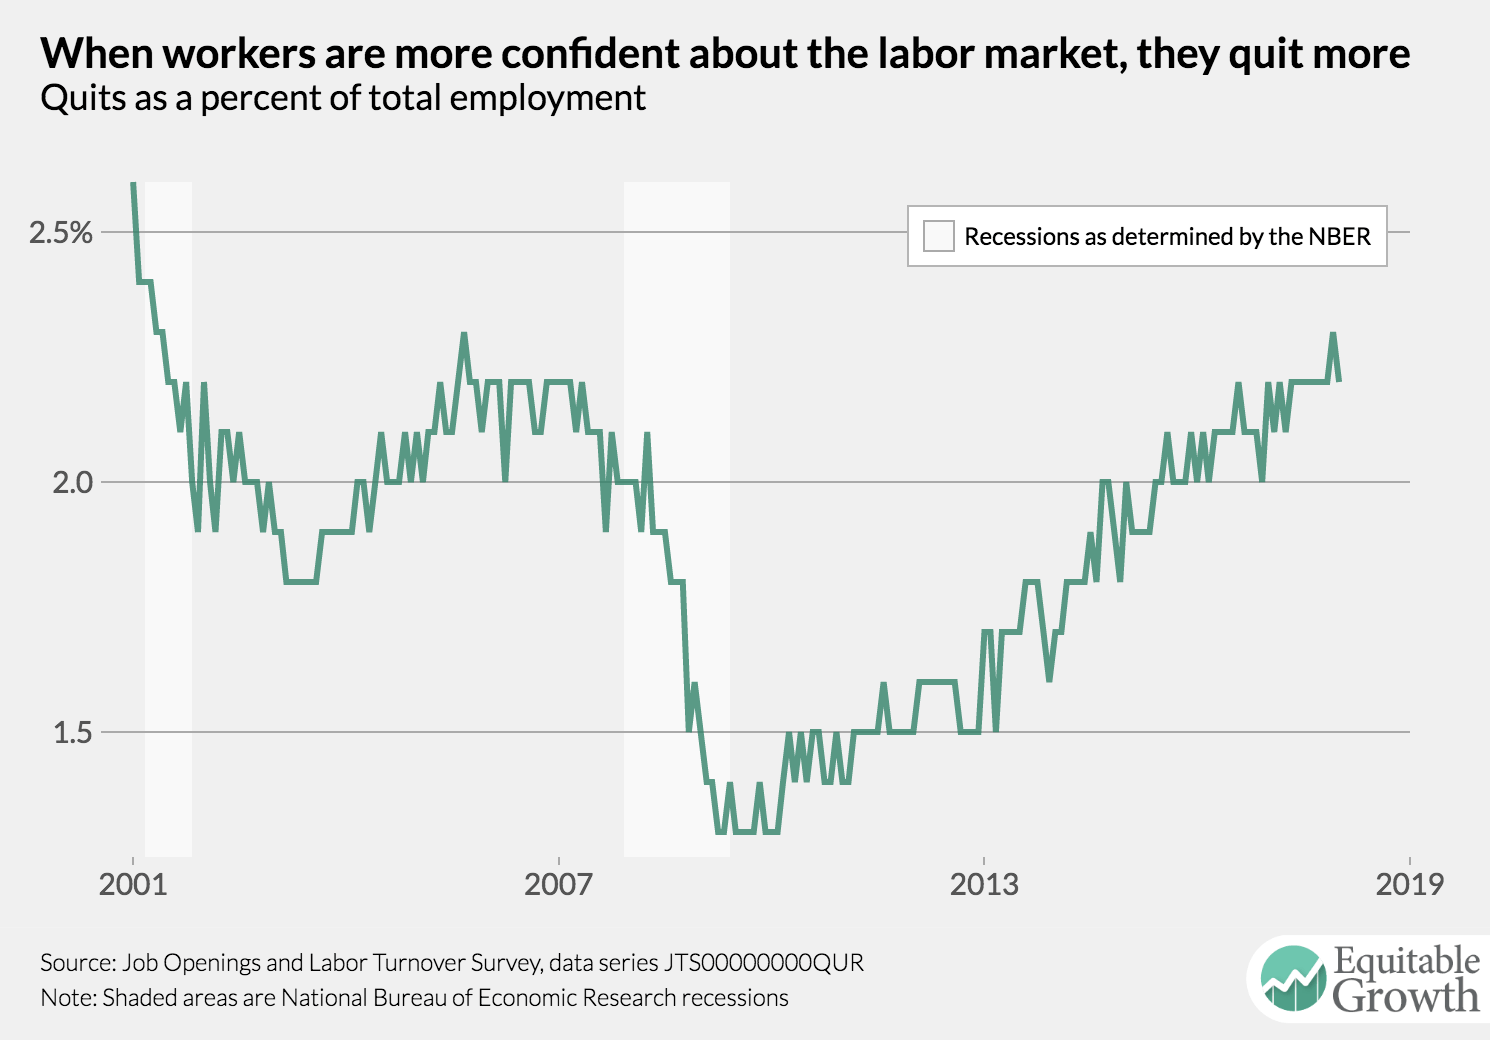
The Bureau of Labor Statistics revises the JOLTS data every year with the release of the January data. The revised data show that the quits rate was 2.3 percent in December last year, but then fell back to its regular 2.2 percent in January 2018.
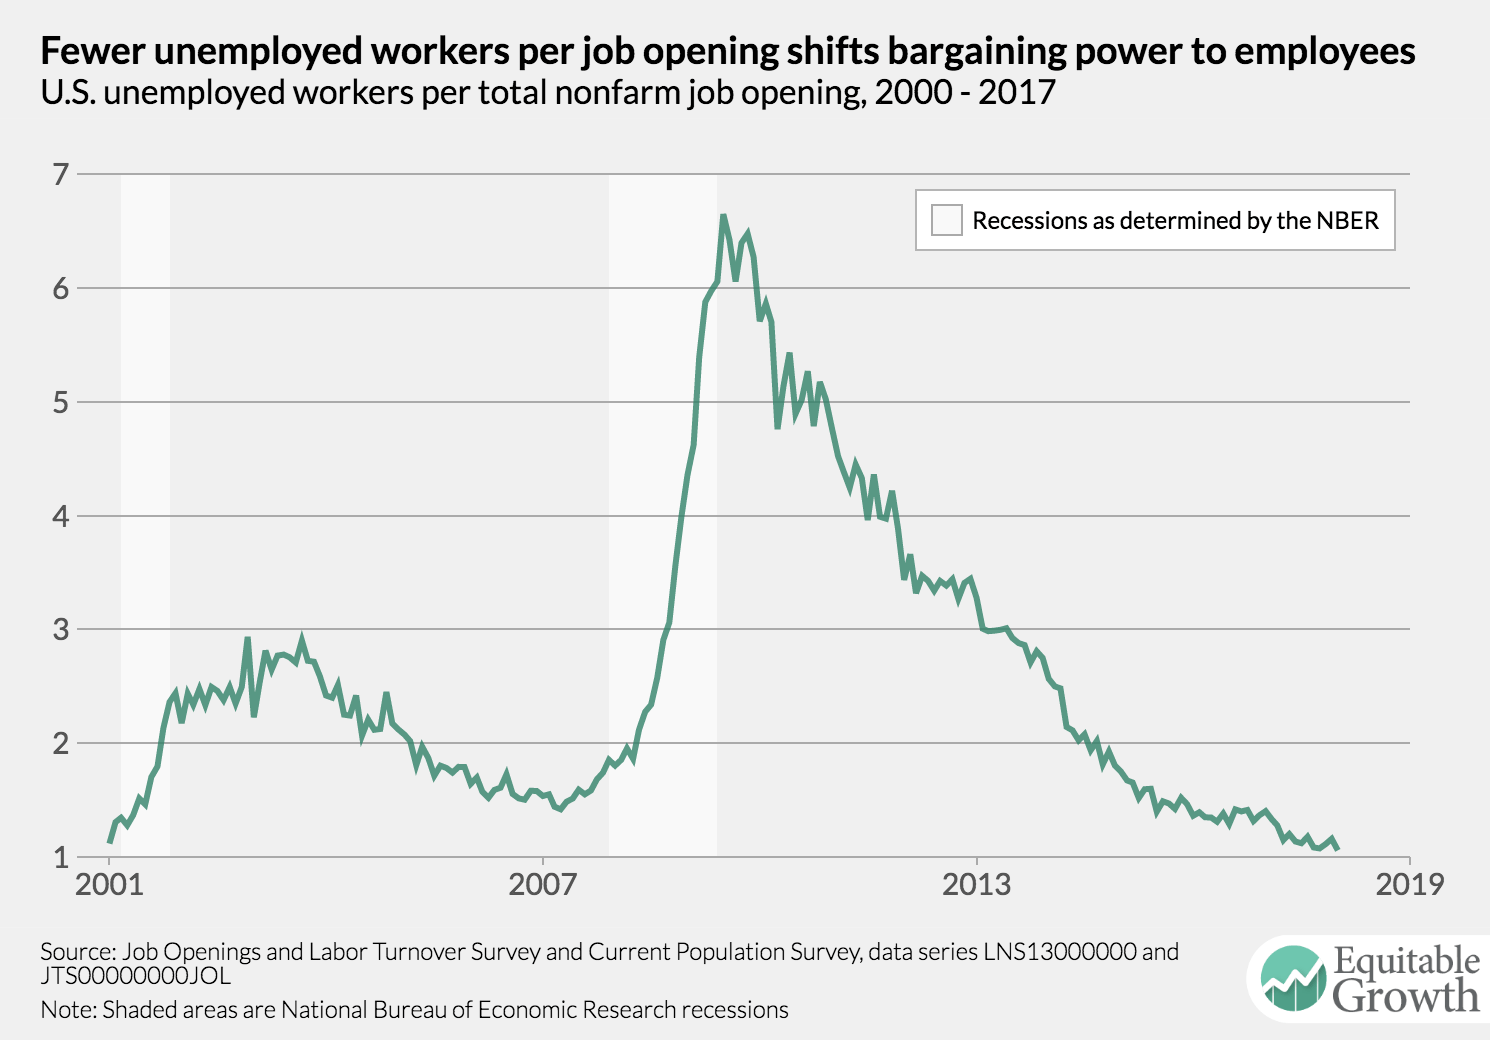
The ratio of unemployed workers to job vacancies hit a new all-time low of 1.06 in January.
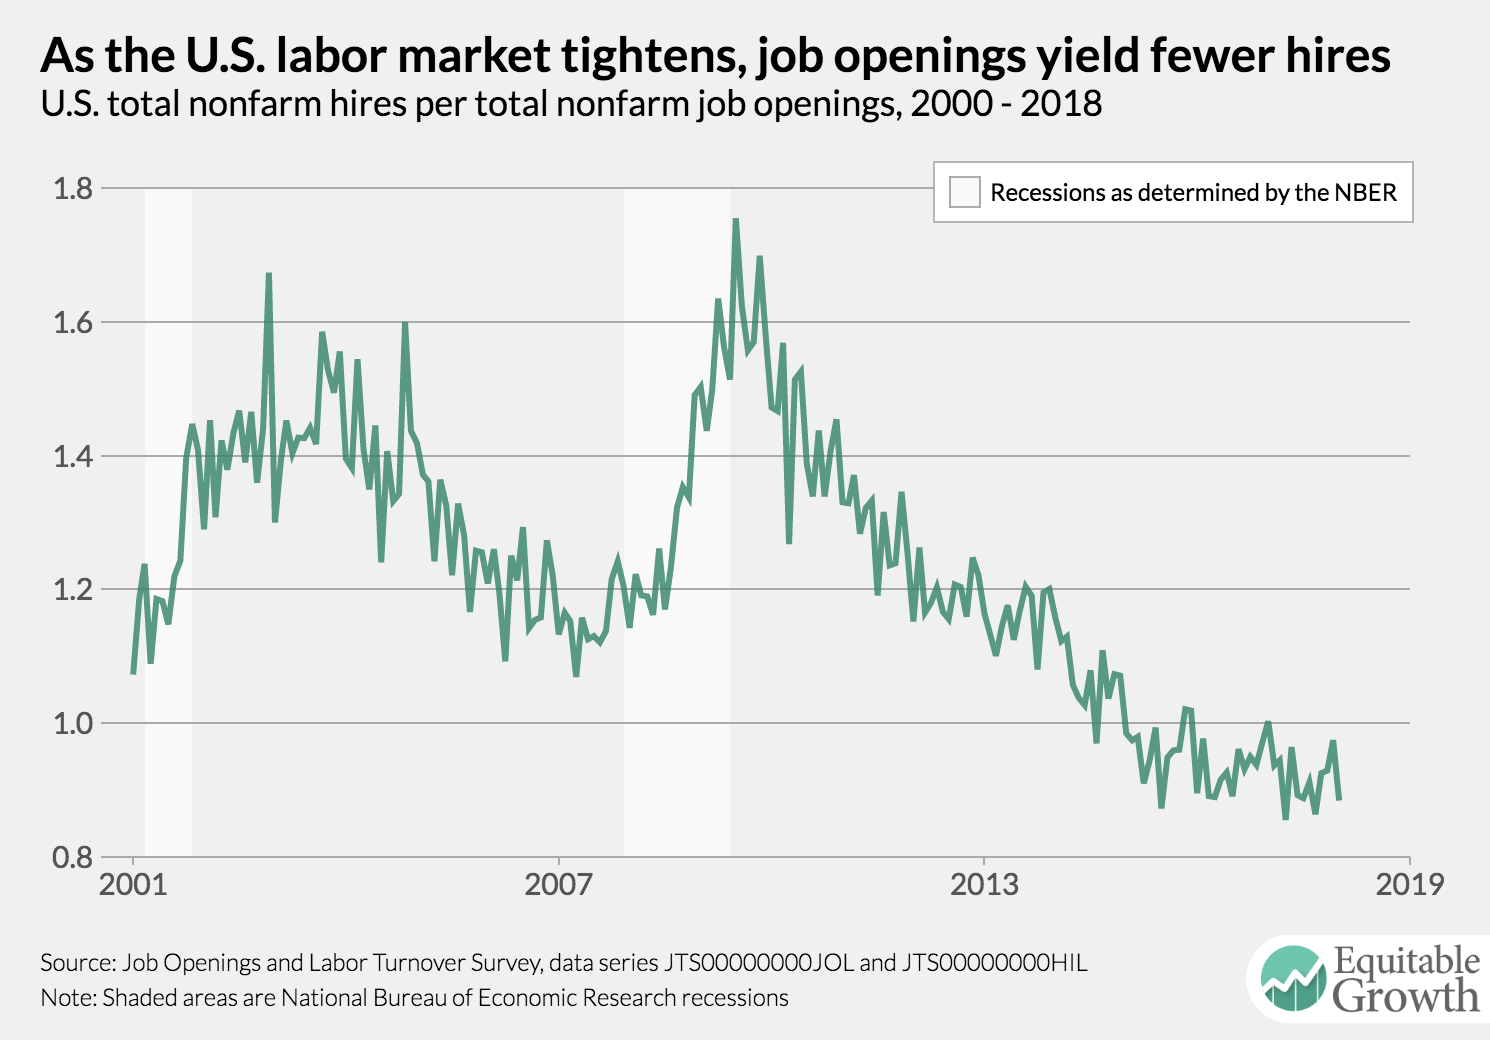
With the annual revisions to the data, the vacancy yield increasingly looks as though it has leveled off after years of decline.
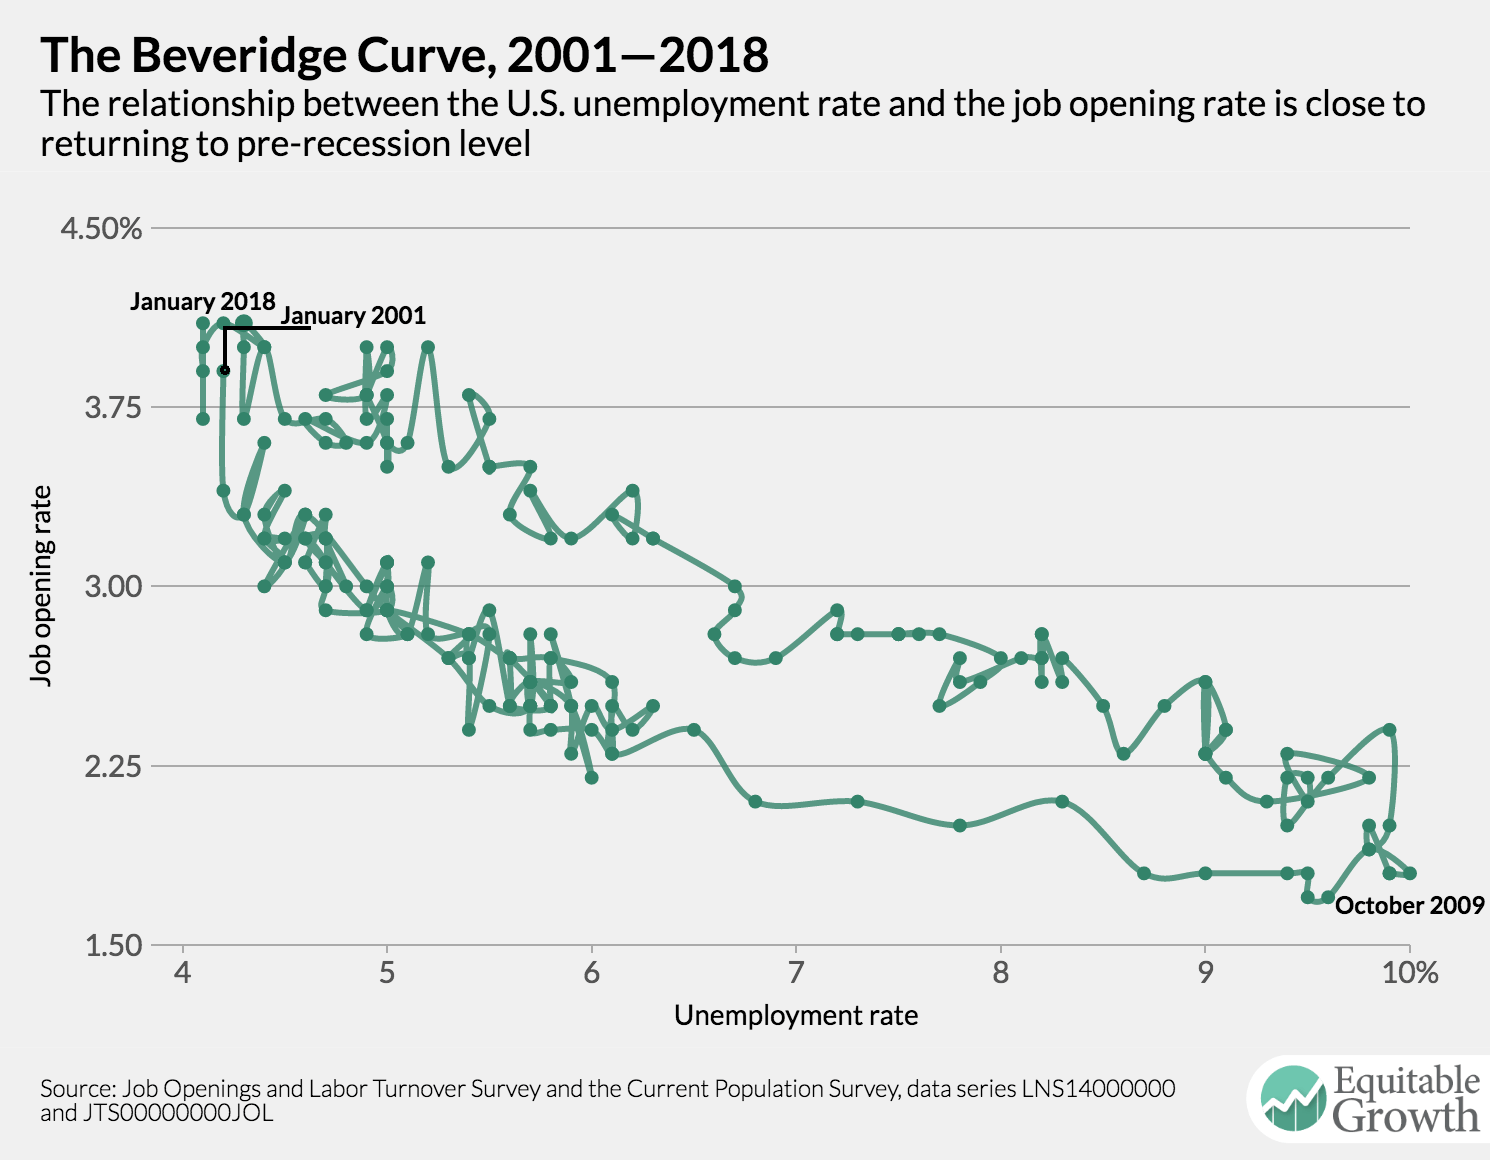
The job openings rate jumped up to 4.1 percent in January. Together with a 4.1 percent unemployment rate, the latest job openings rate implies that the Beveridge Curve is near its relationship during the 2001-2007 era prior to the Great Recession.