JOLTS Day Graphs: December 2017 Report Edition
Every month the U.S. Bureau of Labor Statistics releases data on hiring, firing, and other labor market flows from the Job Openings and Labor Turnover Survey, better known as JOLTS. Today, the BLS released the latest data for December 2017. This report doesn’t get as much attention as the monthly Employment Situation Report, but it contains useful information about the state of the U.S. labor market. Below are a few key graphs using data from the report.
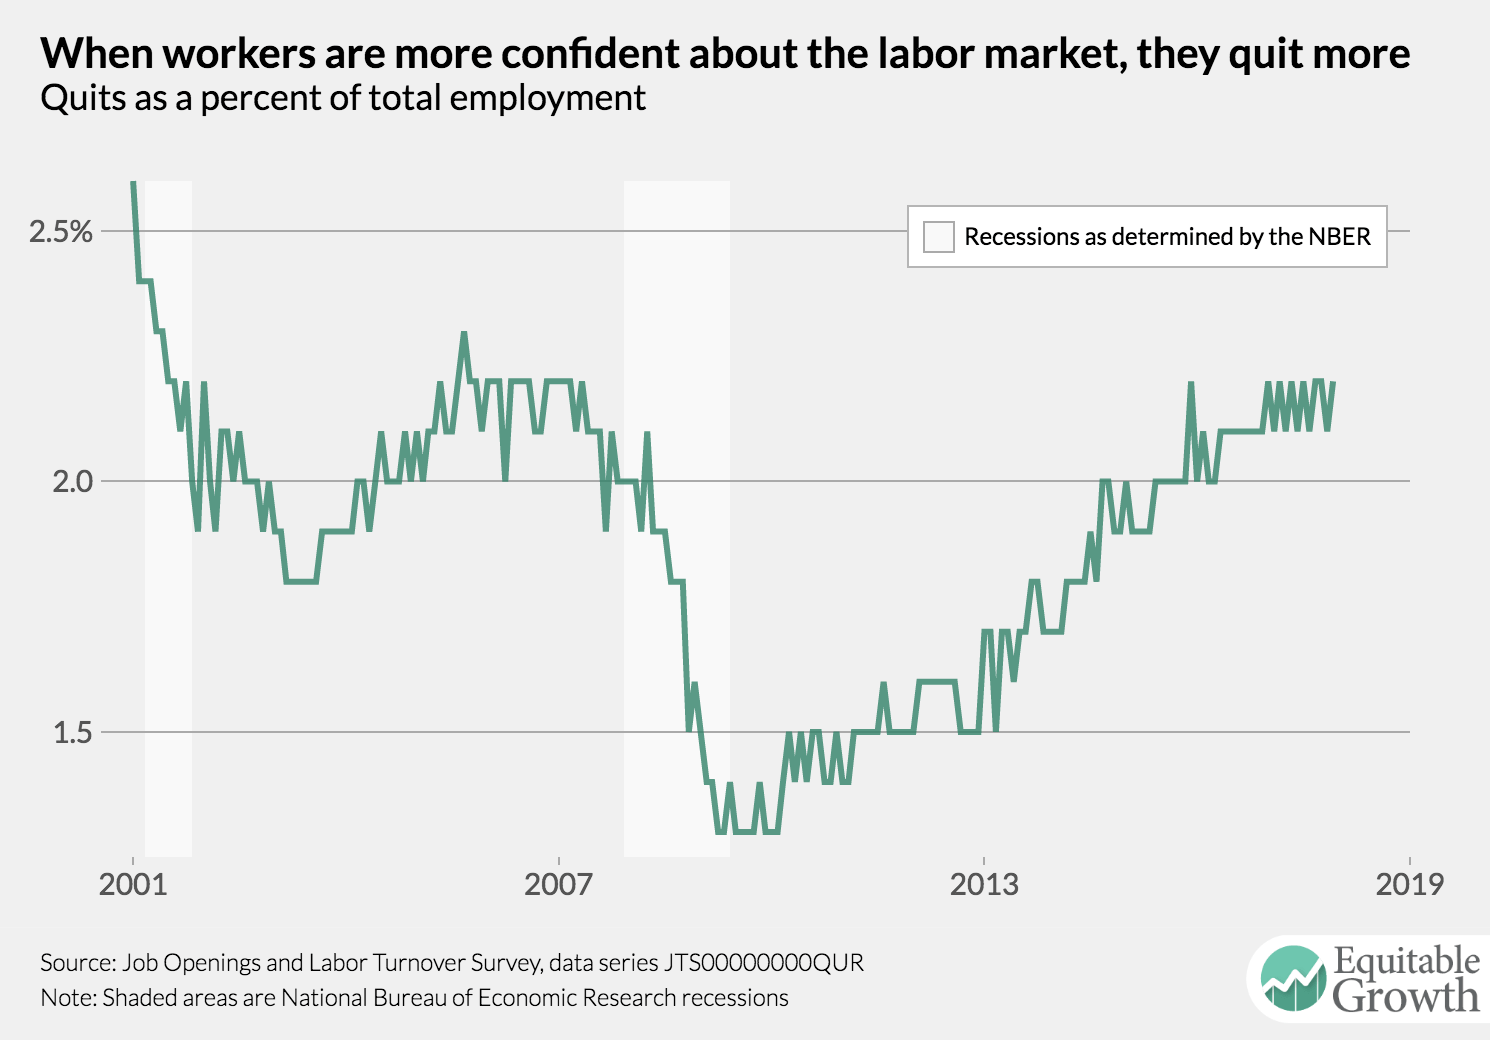
The quits rate ends 2017 where it started the year: at 2.2 percent.
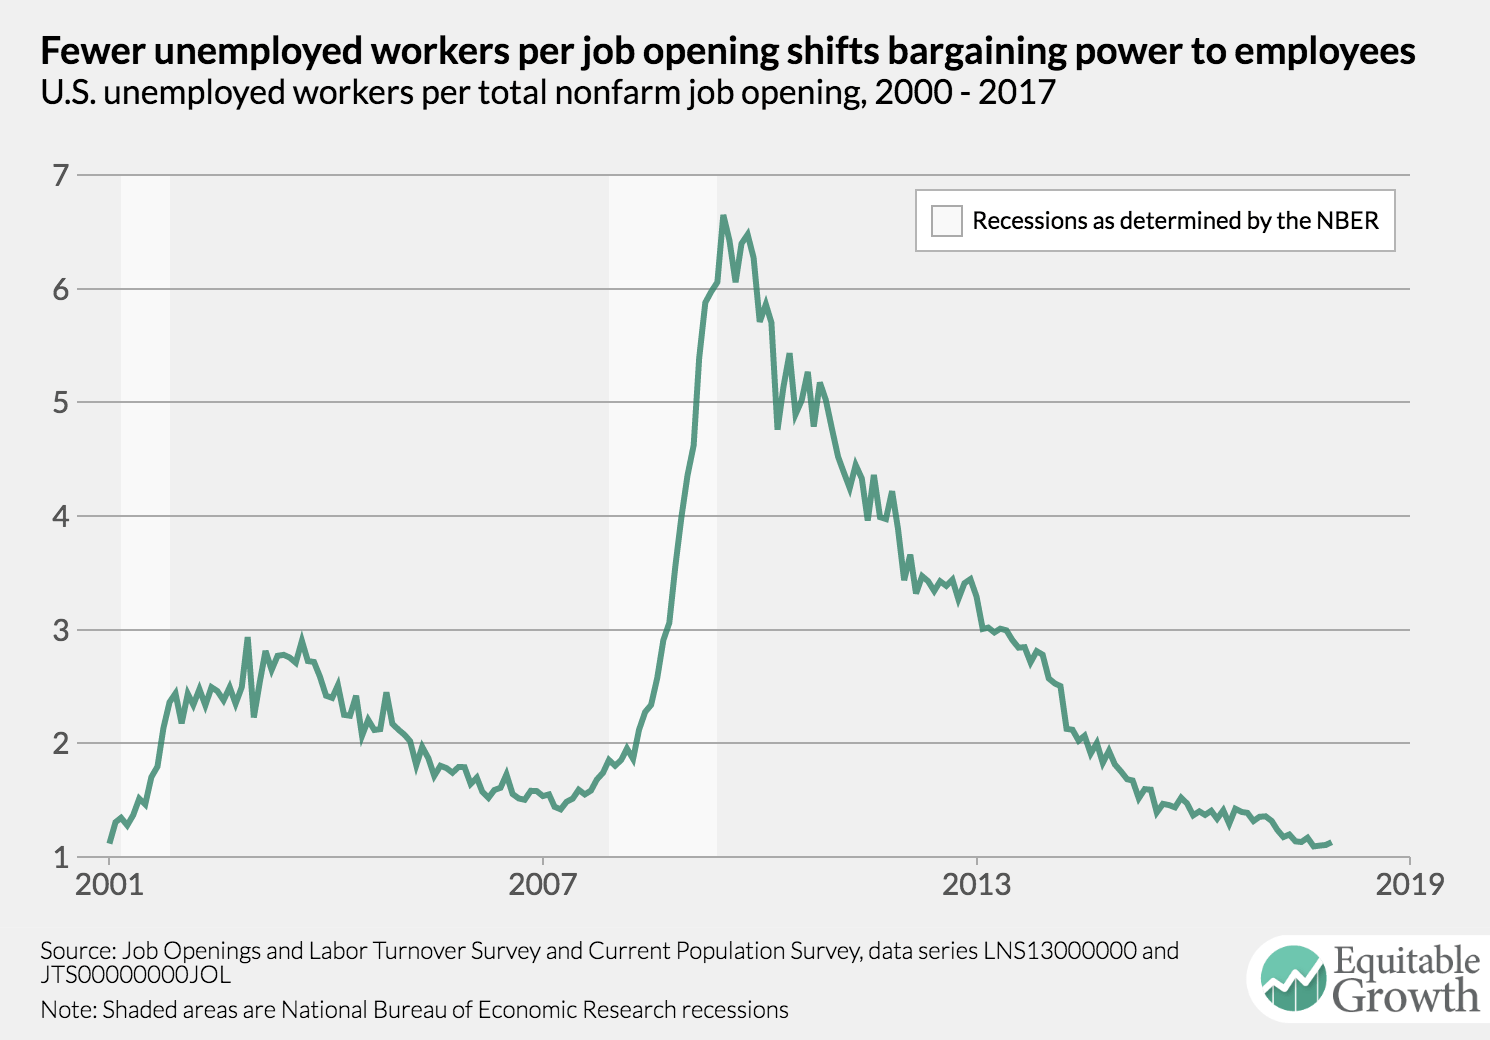
The ratio of unemployed workers to job vacancies rose slightly in December, but still remains near historic lows.
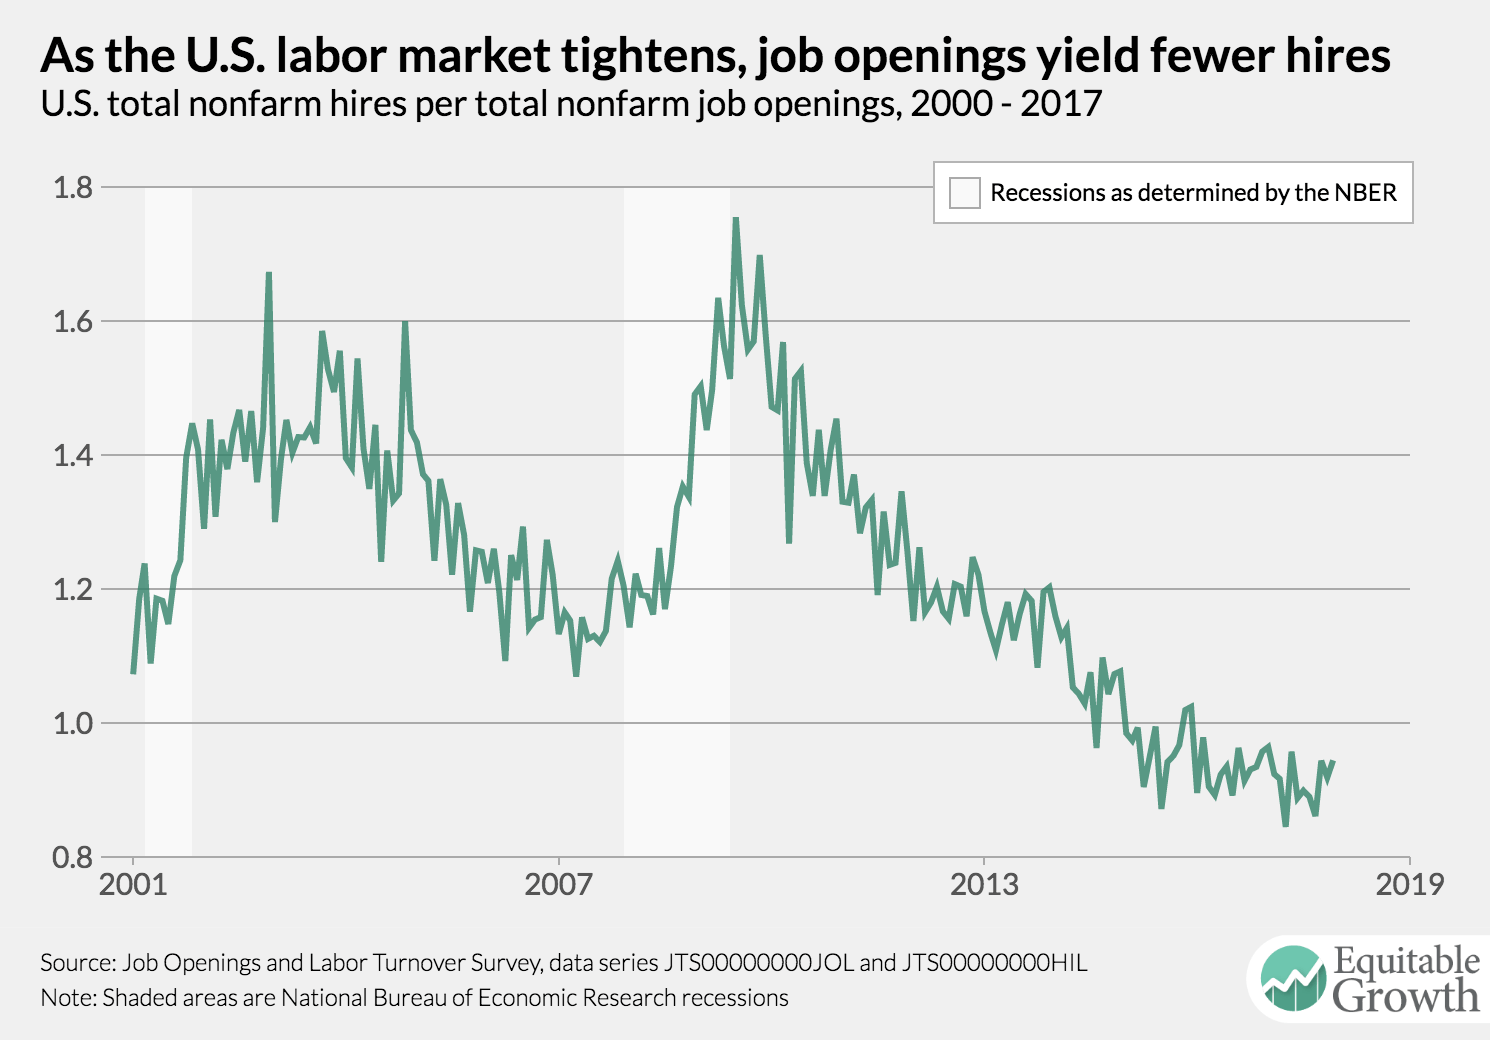
After trending downward during the recovery from the Great Recession, the vacancy yield has risen to a slightly higher level over the past three months.
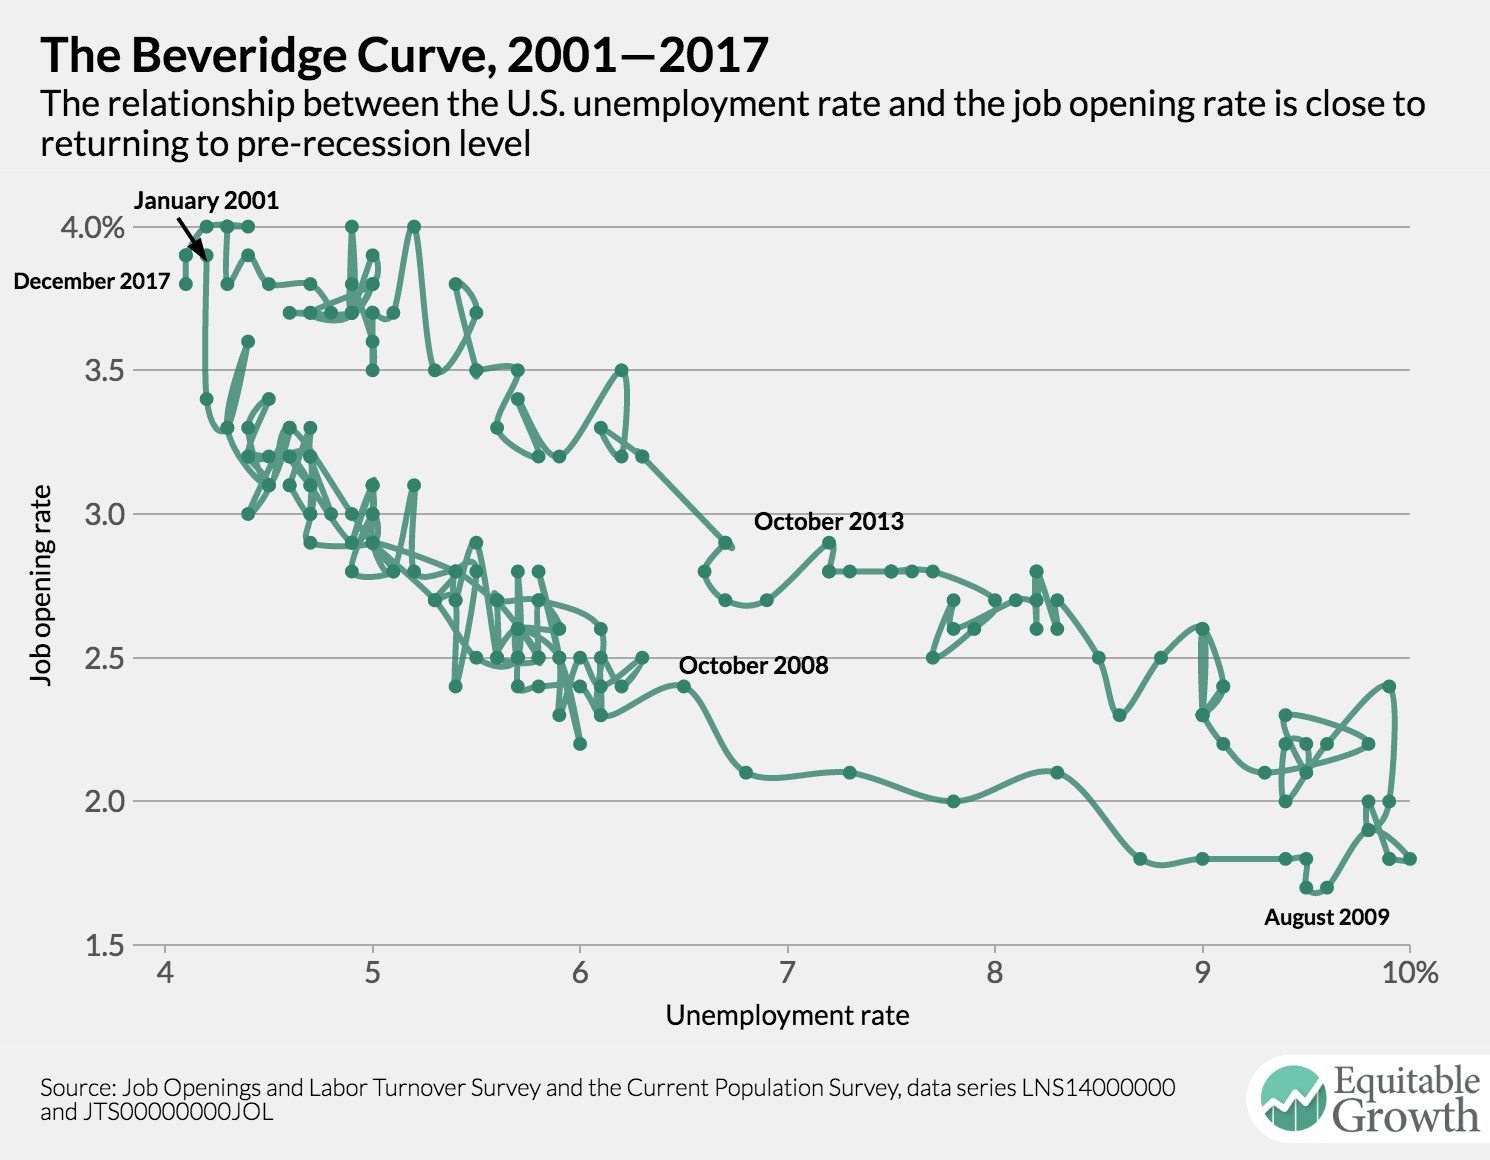
The Beveridge Curve continues its move back to its pre-recession relationship, a signal that unemployed workers can readily be hired into open jobs.