JOLTS Day Graphs: August 2017 Report Edition
Every month the U.S. Bureau of Labor Statistics releases data on hiring, firing, and other labor market flows from the Job Openings and Labor Turnover Survey, better known as JOLTS. Today, the BLS released the latest data for August 2017. This report doesn’t get as much attention as the monthly Employment Situation Report, but it contains useful information about the state of the U.S. labor market. Below are a few key graphs using data from the report.
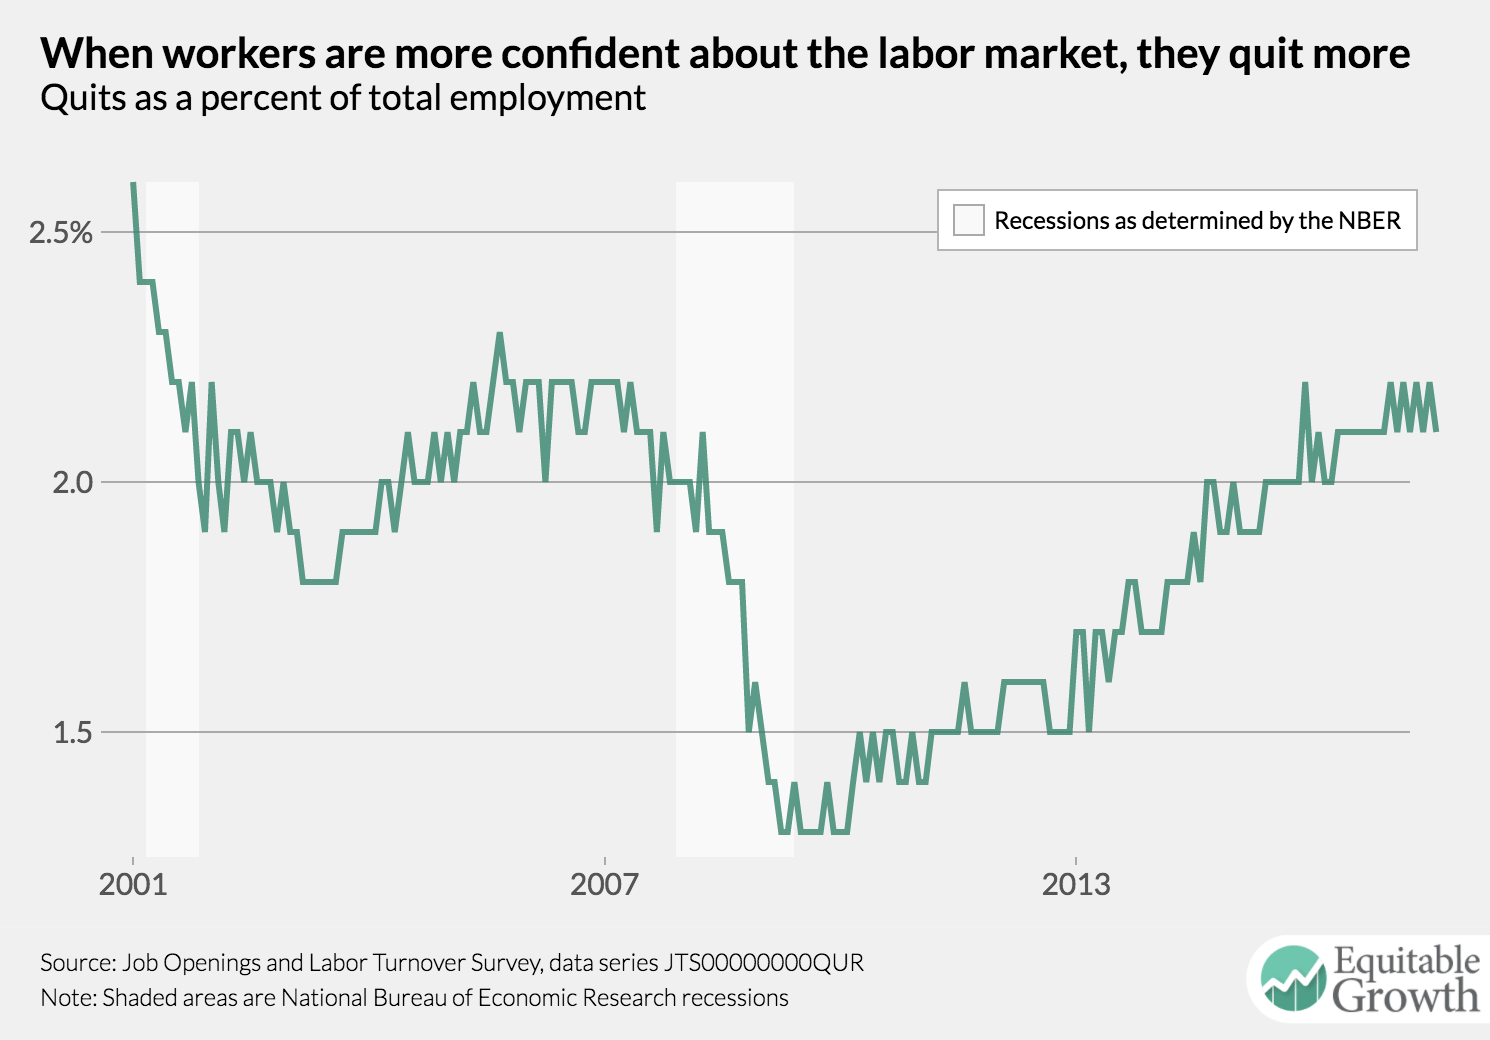
The quits rate continued its trend of not moving much in August, registering at 2.1 percent. With the exception of a few ticks up, it’s been stuck at that level since May 2016.
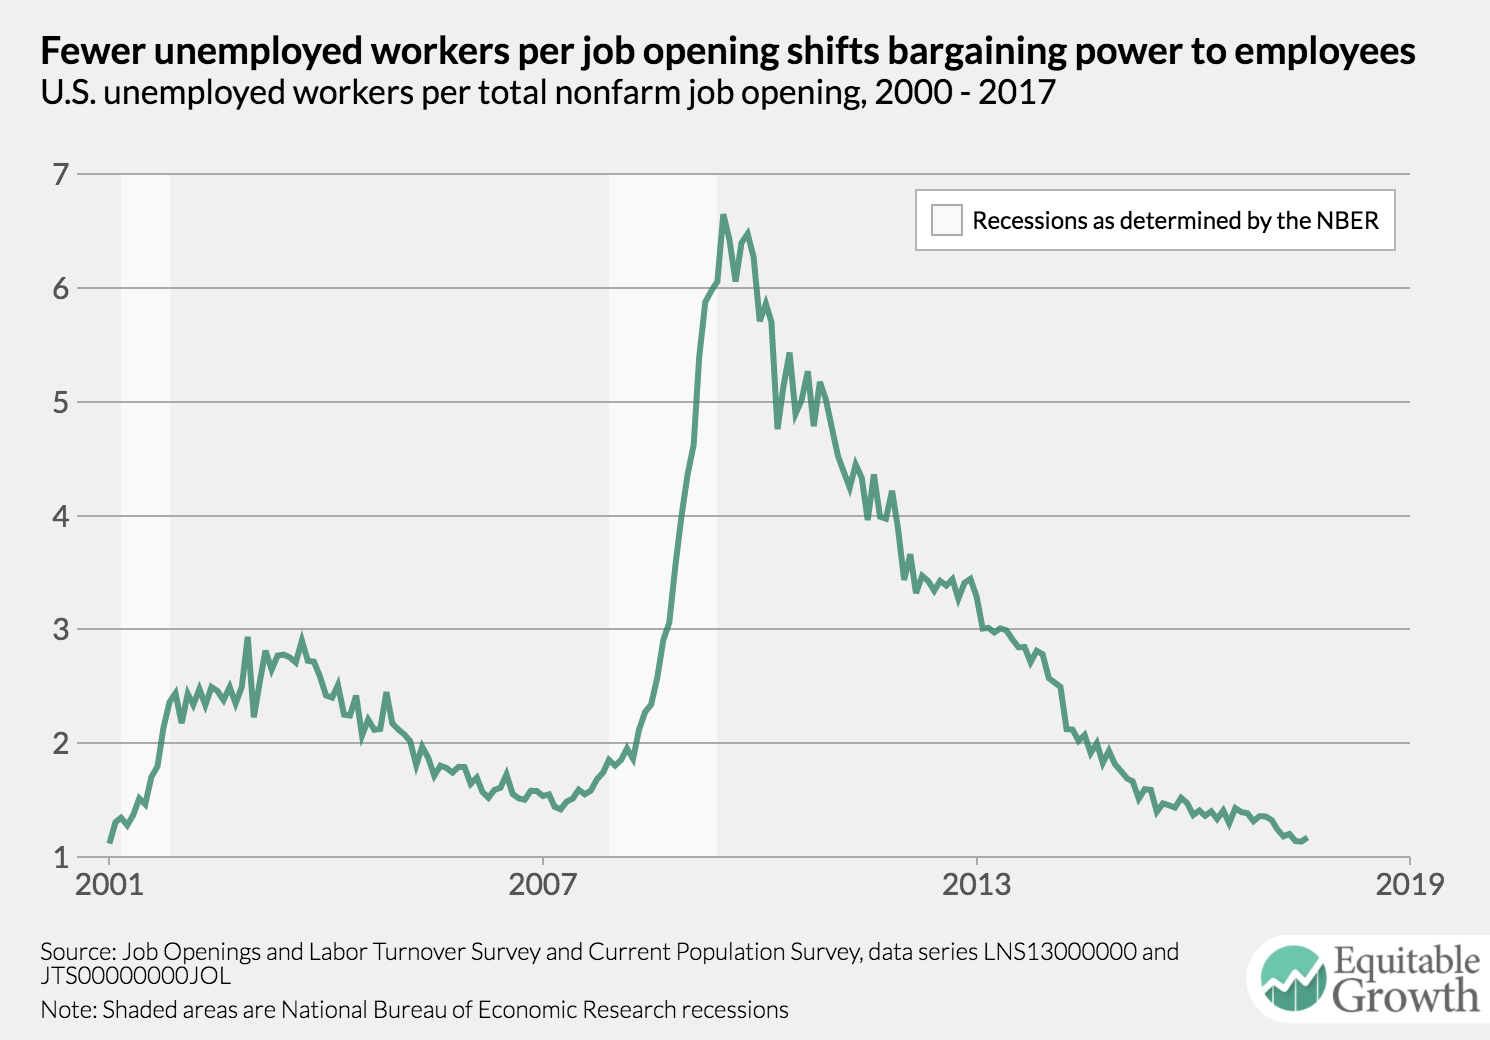
While the ratio of unemployed workers to job openings did not hit a record low in August, it’s still near the lowest levels seen during the period JOLTS data cover.
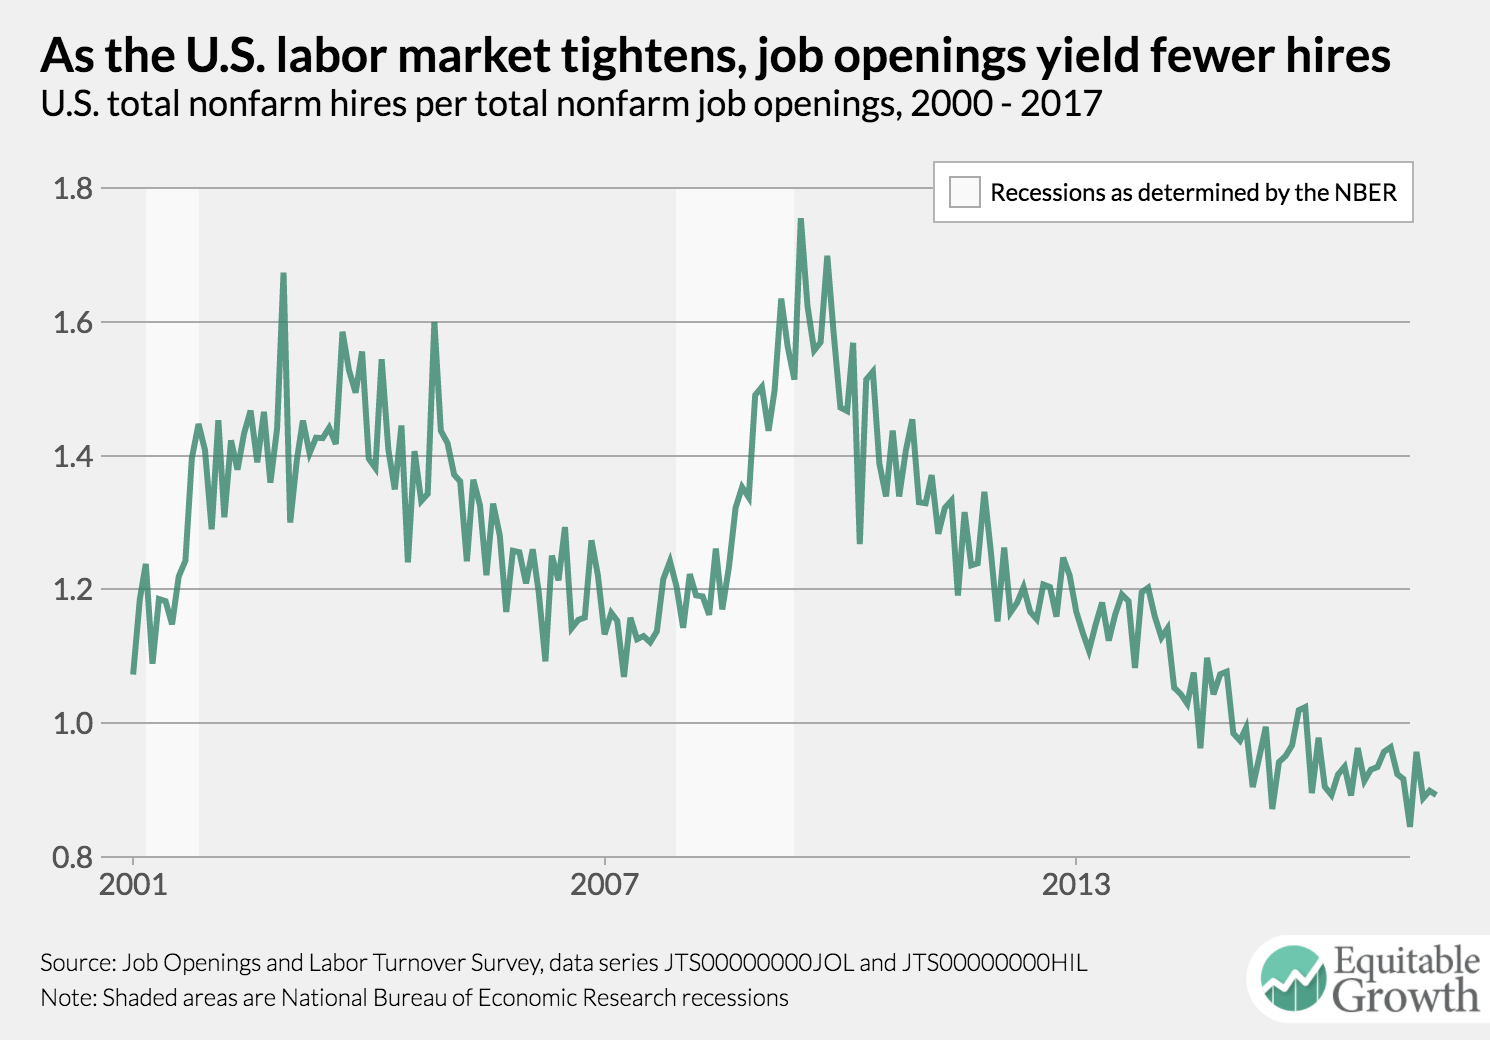
Employers are still getting fewer than one hire per job opening, with the vacancy yield coming in at 0.89 in August.
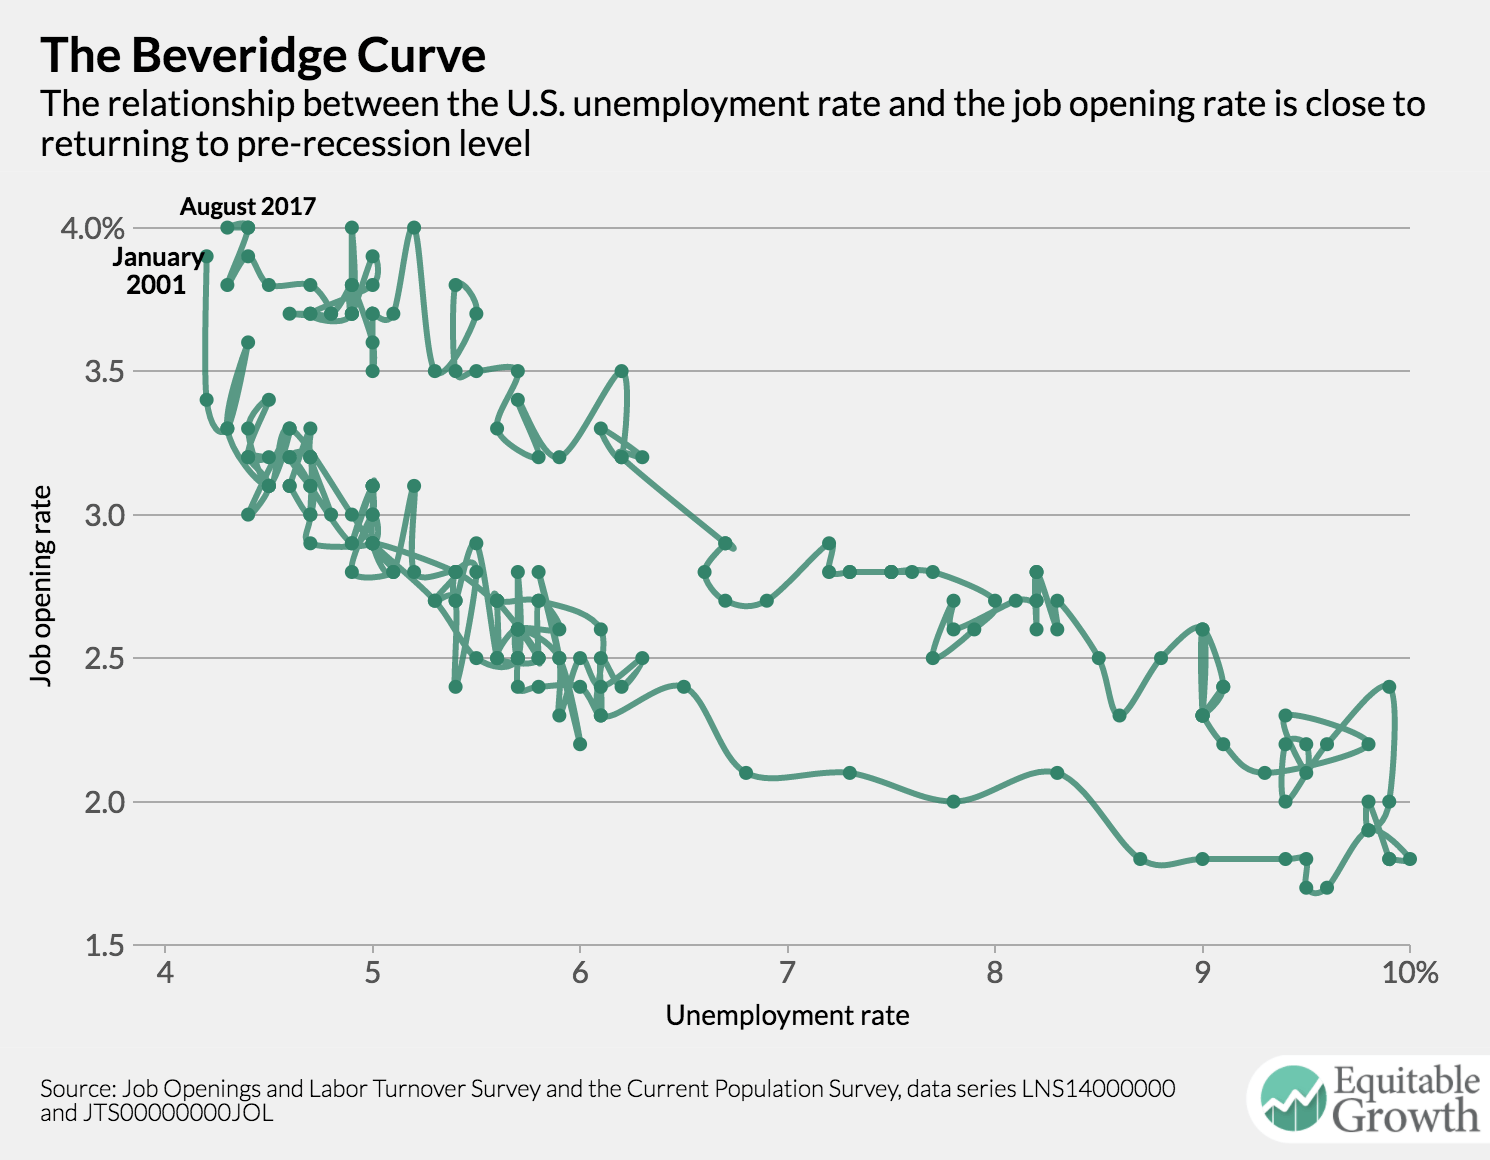
The Beveridge Curve is quite close to its pre-Great Recession relationship, but is not quite there yet.